Darrell Roundy and Dr. Steven Petersen, Department of Plant and Wildlife Science
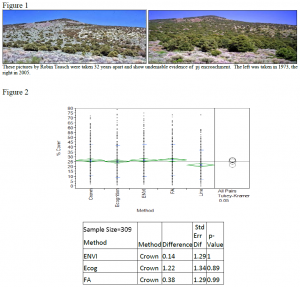
Pinyon and juniper (pj) encroachment is an ecological problem in the western United States. As these species expand they replace valuable sagebrush and grassland communities decreasing forage for livestock and wildlife, reducing habitat for multiple sagebrush obligate species and increasing fuel loads that may lead to large, high severity fires and subsequent weed dominance (McIver et al 2010) (See Figure 1). Ground methods used to measure tree cover and assess potential fire danger and ecosystem degradation are often time consuming and labor intensive (Booth et al 2005). Assessment of tree cover and fuel loads from remotely-sensed imagery could be more rapid and economical than ground methods.
We measured pinyon and juniper trees on approximately 300 33×30 meter plots across Utah using the crown diameter ground measurement. Crown diameter of a tree was assessed by measuring the widest diameter and then the perpendicular diameter of every tree on each subplot. The area of each tree was then calculated and all the tree areas were summed and divided by the total are of the subplot to get the percent cover of each subplot.
We used 2009 1m spatial resolution NAIP imagery, (National Agriculture Imagery Program, downloadable for free from Utah’s AGRC website) and a remote sensing technique called feature extraction to estimate tree covers from the lab. Feature extraction is a technique in which one can use an aerial image to classify objects by selecting objects to train the program to classify across large areas, or one can create a rule set to select for attributes based on their certain characteristics (brightness, color, etc…). We used 3 different object based image analysis programs, ENVI Zoom 4.5 (classify by selecting examples), Feature Analyst (classify by selecting examples), and eCognition (classify by creating a ruleset). Therefore, our objective was not only to see if we could accurately remotely sense tree cover, but we also wanted to see if there was variation between the different programs.
These programs classify the images and create a layer of polygons (representing the trees) which can be overlaid on an aerial image using GIS software called Arcmap. Our field crew took GPS coordinates of each subplot so that we could accurately overlay a 33x30m square on our aerial image. With Arcmap, we were able to clip our tree polygon layer to our subplot square and then calculate the area of the tree polygons within the subplot. In this way, we were able to compare remotely sensed tree cover to ground measurements.
We used an analysis of variance and the Tukey-Kramer analysis to assess the difference between our methods. We assumed that measuring the crown diameter of each tree was the most accurate method and compared our remotely sensed tree covers to those of the crown diameter. We found that there was not a significant difference between any of the methods. In fact, our error was on average less than 1%. From our preliminary research we can conclude that using NAIP imagery to estimate tree cover on Utah range lands is as accurate as if we were to measure trees on the ground. We still plan to do a site by site analysis of accuracy and a single variable t test between each technique. We are also in the middle of using some equations developed by Robin Tausch to calculate tree biomass on each subplot and see if there is a correlation between remotely sensed cover and biomass.
References
- Booth, D.T., Cox, S.E., Fifield, C., Phillips, M., Williamson, N. 2005. Image Analysis Compared with Other Methods for Measuring Ground Cover. Arid Land Research and Management 19: 91-100.
- McIver, J.D.; Brunson, M.; Bunting, S.C., and others. 2010. The Sagebrush Steppe Treatment Evaluation Project (SageSTEP): a test of state-and-transition theory. Gen. Tech. Rep. RMRS-GTR-237. Fort Collins, CO:U.S. Department of Agriculture, Forest Service, Rocky Mountain Research Station. 1 pp.

