Gregory B. Tilton and Drs. Robert L. Park & Jerran Flinders, Animal Science
The focus of this project was two-fold. First, to test whether RAPDS, a genetic marker finding technique, could be used to find markers in three separate sire/offspring groups of horses. Second, to determine whether we could use RAPDs to produce a similarity index indicating how genetically related the different groups were to each other, a process that may be valuable in a future genetic study of horse gait. We used the DNA from three horse sires and seven of their offspring, giving a total of twenty-four different horses. The individuals, all of which are registered Missouri Foxtrotters, are located on the Juddabeth Ranch in Snowville, Utah.
Under the direction of Dr. Jerran Flinders and his staff, blood samples were taken from War Eagle’s Geronimo, War Eagle’s Southern Major, John Henory, and their offspring. The DNA was then extracted from the blood, and some of each sample was added to one of three tubes, according to sire. These three DNA mixtures, which represented each sire and its offspring, were then screened using RAPDs.
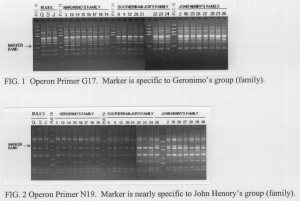
RAPDs, pronounced ‘rapids,’ stands for Random Amplified Polymorphic DNA. A RAPD reaction involves various ingredients, including a short ‘primer’ piece of DNA. One primer, when combined with whole DNA and exposed to the right conditions, will produce a characteristic pattern when the reaction is viewed on an electrophoresis gel (see Figs. 1 and 2). Since almost all individuals are genetically different, they will sometimes produce different gel patterns.1
We used each primer with each DNA mixture, then compared the resulting gel patterns. Periodically, a primer would produce a different gel pattern with one horse group than with the other two groups. This primer was then tested separately with DNA from each individual horse to see whether all the horses in a group had the same pattern. The short-term goal was to find a primer producing a ‘band’ that was found in all the individuals of one group and in none of the individuals in the other two groups.
After screening 331 different primers, we found three that came close to fulfilling expectations. Figure 1 shows the gel pattern for Operon primer G17. This primer produced a band in Geronimo’s group that is not found in any of the other horses. All but one of Geronimo’s offspring carry the marker. Figure 2 is similar, except that it shows the gel pattern of Operon primer N19 which produces a ‘marker band’ in John Henory’s group. Although not shown, Operon primer Nl5 produced a marker in Southern Major’s group. No one primer produced a marker that was in 1 00% of the members of one group and in 0% of the other two groups, but given more time and screening, we are confident that these types of markers could be found.
We accomplished our second goal of using RAPDs to create a genetic similarity index with the aid of “Advanced Quantifier,” a program developed by Bioimage. The program analyzed the gel patterns in one group of horses and compared it to the gel patterns of the other two groups. It then calculated a % similarity based on how closely the gel patterns matched each. We used this method to produce similarity numbers for the three different horse groups.
Similar to the RAPD analysis by Comincini et. al.2, we selected twenty random primers from the 331
already screened. About half of these had produced identical gel patterns in all three horse groups,
while the other ten produced patterns with varying levels of differences. Based on these patterns for
these twenty primers, we found that the Geronimo and Southern Major groups averaged 93.8%
genetic similarity, the Geronimo and John Henory groups averaged 93.4% genetic similarity, and the
Southern Major and John Henry groups averaged 91.4% genetic similarity.
The data produced matched the genealogy of the horses. Geronimo and Southern Major, the two
horses that appeared most related, are in fact half-brothers. However, we feel that twenty primers
are not enough to give a highly accurate similarity index. By using more primers in the analysis,
especially those primers that gave the most different gel patterns between the three horse groups, we
could increase the degree of accuracy.
References
- R.W. Michelmore et al., Proc. Natl. Acad. Sci. USA, 88: 9828-9832.
- S. Comincini et. al., Heredity, 76: 215-221
- Special thanks to Mathew Dalton and George Flinders for their help and support.

