Calvin Quigley and Dr. Richard Gill, Biology
Introduction-
Coral reefs represent an invaluable natural, providing $30 billion dollars of fishing and recreational profits worldwide, and housing nearly a quarter of the oceans species [1, 2]. However, threats such as climate change, ocean acidification, coastal development and overharvesting have destroyed more than a fifth of the worlds coral reefs in recent decades[3]. One of the most common management plans that has been implemented to help protect and restore coral reefs is the establishment of marine protected areas (MPAs)[4]. MPAs have been proven to be effective in helping restore fish populations and coral cover, however the majority of MPAs are large, covering multiple square kilometers[5]. In Saipipi, a small village in Samoa, the people have reserved a small MPA of approximately 300 square meters. My project sought to study the impact of this extremely small-scale MPA, and determine if it was effective in conserving and restoring reef fish populations on the reef in Saipipi.
Methods-
Study Area- The MPA off the shore of Saipipi covers about 300 meters2 and is located at 13°38’24.0″S 172°11’20.7″W, around 1000 feet off shore. The fringing reef occurs in <2 meters of water, and visibility ranges between 10 and 20 meters. Acropora spp. is the dominant coral variety, and other species include Porites spp., Montipora spp., Fungia spp., Lobophyllia spp., Goniastrea spp., and Millepora spp. Benthic cover consists of approximately 50% live coral and 50% coral rubble, with little macroalgae cover. Data Collection- We deployed remote underwater video systems in a gradient from the center of the MPA to the outermost edge to determine the environmental impact and edge effects of small MPAs in Samoa [6]. We used a GoPro Hero 4 to record one hour of footage from the center of the MPA, 50 meters from the center, 50 meters from the outer edge, and the outer edge of the MPA. All fish that entered into the frame within a 2 meter range and to a depth of field of up to 5 meters were counted and identified to the species level. Individuals who remained within the field of study for the duration of the video or who left and returned and were able to be identified as repeats were not counted. Data Analysis- Relative abundance was calculated by comparing the total number of individuals of all species that were observed throughout the study period. Using the observed abundance of each species present in each treatment, we calculated two indexes of diversity: a Chao1 estimate for total species richness, and a Shannon diversity index, which incorporates species richness and evenness to produce a value that is useful in describing relative diversity [7, 8].
Results-
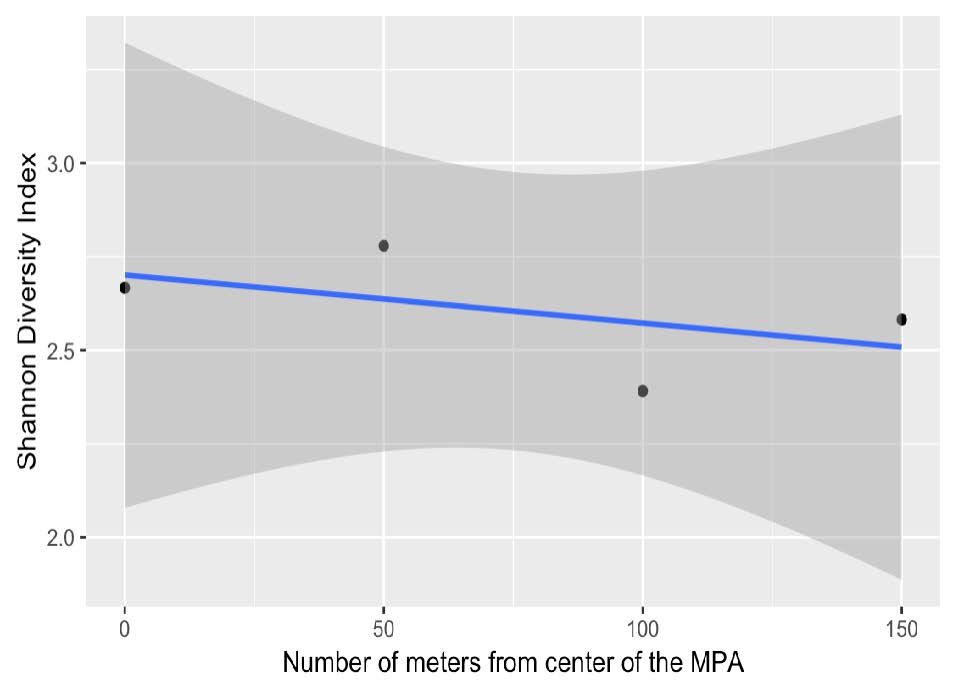
In our video surveys we observed 37 unique species of fish, the most well represented species being Stegastes nigricans (dusky farmerfish), Ctenochaetus binotatus (twospot surgeonfish), Acanthurus triostegus (convict tang), Chlorurus spp. (parrotfish), and Siganus spp (rabbitfish). Stegastes nigricans are a highly territorial fish with extreme site fidelity, therefore it is likely that they reoccurred in the multiple video files of the same sample site, leading to overrepresentation in this survey. Acanthurus triostegus were almost always observed in large schools, passing quickly through the study site. This could also potentially lead to over representation because one group of fish could have been picked up by all four camera systems. We mapped trends in total fish abundance (Figure 1), Chao1 estimates for species richness (Figure 2), and Shannon Diversity Indexes (Figure 3) as functions of distance from the center of the MPA. We used linear regression models to quantify these relationships, and observed a negative trend for all three variables, with abundance and diversity decreasing as distance from the center of the MPA increased. With an α of 0.05, none of the relationships proved to be significant, but the relationships for total fish abundance and Chao1 species richness were very nearly significant (.05245 and .0902 respectively).
Discussion and Conclusion-
Despite the lack of any statistically significant relationships, my data provides excellent preliminary support for the hypothesis that even MPAs as small as 300 m2 can have observable impacts on reef fish abundance and diversity. I believe that additional data collection with this same cost effective methodology could provide stronger evidence of this relationship, which could be used to help motivate the village to expand the MPA to promote sustainable harvesting. The addition of a temporal variable to this study after altering the size of the MPA would be extremely valuable. By taking repeated measurements over time after expanding the MPA, it would be possible to isolate and quantify the impact of each additional square meter of protected area. This data would be invaluable in helping local governments throughout the South Pacific understand the value of establishing MPAs on their own reefs.
References 1. http://icriforum.org/sites/default/files/Economic_values_global%20compilation.pdf 2. https://coral.org/coral-reefs-101/why-care-about-reefs/biodiversity 3. Clive Wilkinson, ed., Status of Coral Reefs of the World: 2008 (Townsville, Australia: Global Coral Reef Monitoring Network, 2008), pp. 5, 8–9. 4. Administration, US Department of Commerce, National Oceanic and Atmospheric. “What is a marine protect?”. oceanservice.noaa.gov. 5. Halpern, B. (2003). “The impact of marine reserves: do reserves work and does reserve size matter?”. Ecological Applications. 13: S117–S137. doi:10.1890/1051- 0761(2003)013[0117:TIOMRD]2.0.CO;2. 6. Holmes, T. H., et al. 2013. “A Comparison of Visual- and Stereo-Video Based Fish Community Assessment Methods in Tropical and Temperate Marine Waters of Western Australia.” Limnology and Oceanography-Methods 11 : 337-50. 7. Foggo, A., et al. (2003). “Estimating Marine Species Richness: An Evaluation of Six Extrapolative Techniques.” Marine Ecology Progress Series 248: 15-26. 8. Guiasu, R. C., and S. Guiasu. (2003). “Conditional and Weighted Measures of Ecological Diversity.” International Journal of Uncertainty Fuzziness and Knowledge-Based Systems 11.3 : 283-300.
Figures 1, 2 and 3. Total number of individuals observed (slope of regression line: -0.814, p-value: 0.05245), Chao1 species richness estimator (slope of regression line: -0.113, p-value: 0.0902), and Shannon diversity index (slope of regression line: -0.0013, p-value: 0.494) from different distances from the center of the MPA.


