Austin Hopkins and Dr. Neil C. Hansen, Plant & Wildlife Sciences
This project identifies remote sensing practices to conserve water by optimizing nitrogen (N) fertilization and irrigation strategies. Turfgrass is the most irrigated crop by area (163,800 km2 ), accounting for 1.9% of the continental U.S. This causes negative environmental impacts and puts the future of irrigated turfgrass in question due to increasing water scarcity, especially in the western U.S. More information is needed on how to irrigate in droughts and water limited areas as turf provides significant benefits in our environment such as aesthetics, cooling effects, carbon sequestration, and preventing soil erosion.
Proper water and N is essential for healthy turfgrass. Unfortunately, water and nitrogen are often over applied. Poor fertilizer management affects turf water use efficiency. In drought conditions, over-applying N could negatively impact turf root systems, cause stress on turf health, and cause buildup of salts in the soil profile. A better understanding of N x H2O interactions allows us to cut turfgrass water needs by cutting N fertilizer and thus conserve scarce resources and limit a potential source of pollution.
Kentucky Bluegrass ( Poa Pratensis) was evaluated on three irrigation ( Low, Full, High) and three N rates (Deficient, Optimum, Excessive) in a field study over the course of three weeks. Treatments included a 60% of evapotranspiration (ET) replacement (Low), a complete evapotranspiration (ET) replacement (Full), and an every other day irrigation treatment (High). Nitrogen rates were 65, 130, and 260 kg ha-1 as deficient, optimum, and excessive treatments. N fertilizer (solid urea) was broadcast-applied by hand one day before the start of the study. The turf was otherwise grown and cared for with best management practices. The study was conducted in 27 plots measuring 3.4 x 3.4 m. This study was a full factorial, randomized complete block design with three treatment replications. Using remote and proximal sensors combined we measured normalized difference vegetation index (NDVI), turf canopy temperature, soil water potential, volumetric water content, soil EC, soil temperature, and weather data. Measurements were taken by hand to confirm the veracity of the readings the sensors were reporting. Sensors were collected from Meter group and Apogee. The sensors that were used were NDVI (Decagon SRS), Canopy temperature (Apogee SI-421), Water potential (Meter, Teros 21), Water content (Meter, Teros 12), Weather station (Meter, Atmos 41).
As seen in the figure below, the proximal soil sensors show a clear response to the dry-down experiment. Water potential is a useful indicator of stress. The more negative the water potential is, the more water stress is in the soil and subsequent plants. Water potential remained near zero for the high irrigation treatment as it was largely water saturated for the duration of the study. Water potential for the full treatment averaged -15 kpa which is common for well watered turfgrass. For the low treatment, water potential decreased throughout the dry down experiment until reaching value close to permanent wilting point for turf (-1500 kpas) within 10 days of the start of the study. Canopy Temperature is an effective indicator of water stress on the plant with higher temperatures meaning higher levels of stress.
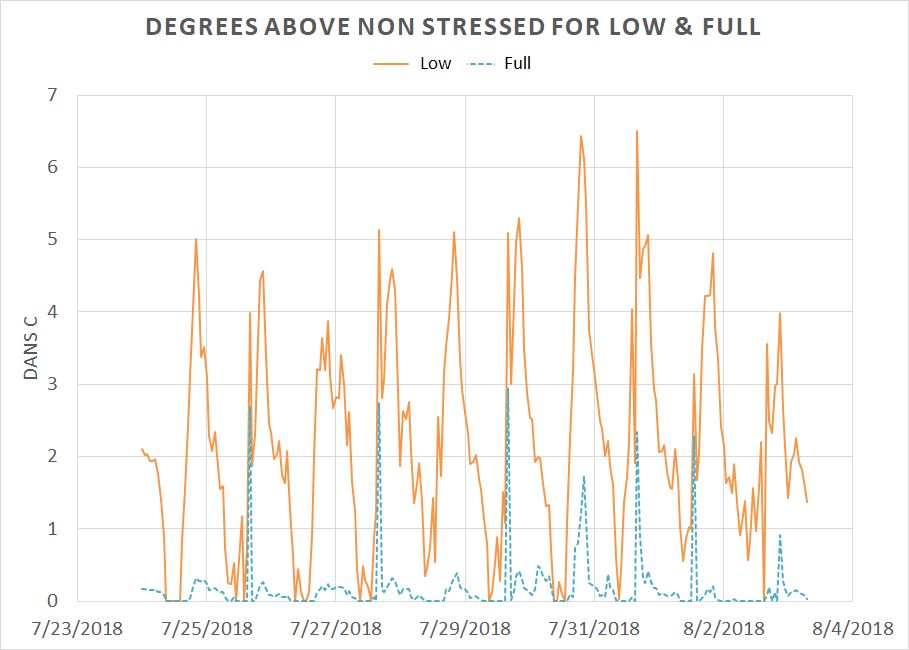
Canopy temperature data was normalized using Degrees Above Non-Stressed (DANS). The high irrigation treatment was used as the non-stressed reference temperature point. The canopy temperature sensors successfully detected when the low water treatment began to be in water stress as demonstrated below. The average DANS for the low and full treatment was 2.25 and 0.2 C for the duration of the study. THis shows that water stress was detectable through only remote sensors. The average canopy temperature was not different among the nitrogen treatments. This indicates that canopy temperature is a robust indicator of drought stress over a wide range of nitrogen levels.
The high irrigation treatment resulted in a significantly higher NDVI value than the other treatments. Variation in irrigation levels are evident in the differences in NDVI values. However, even though the low treatment is clearly under the highest level of stress it does not have the lowest NDVI value. This means that NDVI is potentially an unreliable method of irrigation management in turfgrass. Part of NDVIs unreliability stems from the fact that NDVI experiences fluctuation from both N rate and irrigation rate. N rate had no effect on canopy temperature. Therefore, NDVI cannot be considered a reliable method of irrigation management because it will be unclear if the turf is water stressed or N stressed.
Further research is needed to determine the most efficient method of using remote sensing to manage irrigation. DANS, Soil sensor based, or weather station data based options are all potentially efficient options. This study did find that canopy temperature can be used to determine water stress and base an irrigation plan off of that. NDVI can not reliably be used to manage irrigation systems.
● Fig. 1 (left) Water stress in the low water treatment is demonstrate by the drop in water potential to near permanent wilting point
● Fig. 2 (Right)A non stressed turf will have a low canopy temperature compared to a stressed canopy. When the low treatment experienced the highest stress level it had a temperature 7 degrees higher than the high treatments.


