Taylor Avei and Dr. John Kauwe, Biology
Introduction:
The neuropathology of Alzheimer’s Disease (AD) is well-known as a degradation of neural connections in the brain caused by multiple deposits of Amyloid-beta peptide plaques as well as neurofibrillary tangles of tau proteins [1]. Because of this and successful research, both Amyloid-beta 42 and tau protein levels in cerebrospinal fluid currently serve as important biomarkers for the diagnosis of AD according to the New Research Criteria for the Diagnosis of AD provided by the International Working Group (IWG) [2].
Prior to the current addition of biomarkers, AD diagnosis criteria for “probable” AD status used only clinical exclusion methods of other possible causes of dementia narrowing down to a diagnosis of AD by deduction [2]. However, these criteria have been revised recently to include both amyloid-beta and tau biomarkers as well as amyloid PET scans. Since these changes, AD biomarkers have successfully distinguished AD dementia from cognitively fit patients with a specificity statistic in some studies to be between 85 to 95% [3] [4]. However, despite the direct correlation between the core AD biomarkers and AD pathology, the accuracy of clinical diagnosis varies widely. The use of AD Biomarkers worldwide lack standardization and harmonization of normal ranges and data which also increases the margin for human error in data collection. Because of this, there is an understandable need for additional biomarkers to increase diagnostic accuracy [5] [6]. In this study, we are looking to cell-free single stranded DNA (cfssDNA) as a possible supplemental AD biomarker to that of the core AD biomarkers where methods and data are simple, inexpensive and for the most part, standardized. Cell-free DNA: In a healthy and normal patient, Cell-free DNA is primarily resulting from cells that have undergone apoptosis. Once in the circulatory system of the body, the liver quickly dissipates the cell-free DNA within 10-15 minutes [7]. Cell-free DNA is more commonly known and used as a biomarker for various types of cancer since research has shown notable differences between the cell-free DNA of a cancer patient versus that of a normal patient. Because of this, much of the extraction methods and data analysis of cell-free DNA have been studied and standardized [8] [9]. Recent studies have been conducted on cell-free mitochondrial DNA (mtDNA) to test its viability as an AD biomarker. Low mtDNA concentration levels have been shown in AD levels to be very significant in a group of 48 AD patients compared to that of 36 controls. These low concentrations seemed to also distinguish AD from other dementia-causing diseases such as frontotemporal dementia and Creutzfeldt-Jakob disease [10]. However, replicating studies have shown that low levels of mtDNA also have been found in patients with Parkinson’s disease rendering mtDNA unclear as a distinguishing feature in AD or a shared characteristic for numerous neurodegenerative diseases [11] [12]. With other cell-free DNA types already being studied as possible AD biomarkers, our study aims to assess the viability of cell-free single stranded DNA as a supplemental biomarker for diagnosing AD.
Methods:
Human Samples: Initially, a total of 145 Lumbar cerebrospinal fluid samples were obtained from patients with cognitive impairment from Italian and Swedish (Swedish 1 and Swedish 2) memory clinics. Patients were designated as AD or non-AD according to cerebrospinal fluid (CSF) biomarkers level using established cutoffs: total tau (T-tau) >400 ng/L, phosphor-tau (P-tau) >60 ng/L and amyloid beta 42 (Ab-42) <500 ng/L. All samples were store at -80 degrees Celsius Of the both Swedish cohorts, mean age is 73 years old with a standard deviation of the patients’ age of 10.26 and 11.68 years. Female ratio in Swedish cohorts are 37% and 40% respectively. Italian cohort represent a larger female percentage being 53% female ratio. Overall, our studies had 72 known AD cases diagnosed as a result of meeting established biomarker cutoffs and 73 controls with an overall sex ratio being 41% female Counting cell in CFS Using hemocytometer techniques, 10 μL of CFS were used to count number of cell present per sample. Extraction of Total DNA from Cerebrospinal Fluid: 200 μL of CSF were used for DNA extraction with QIAamp DNA Blood Mini Kit DNA purification protocol; such as protocol was follow as described by manufacture. DNA was eluted into final volume of 50 μL and stored at -20 degrees Celsius pending analysis. We follow laboratory practices and protocols to avoid cross contamination between samples. DNA screening and analysis: Using Qubit Assay Technology and following manufacture protocols, we used 5 to 10 μL DNA were used for quantification. All samples were screened in three independent and separate times. The mean of these values was used determine DNA concentration in each sample. All measurements were scaled on ng/L. In addition, we screened for double-stranded DNA, RNA, and single-stranded DNA. Statistical analyses were performed using a Paired T-test to determine the difference in the mean of the two groups. Nonparametric nominal regression analysis was used to determine if cfssDNA is a significant variable to determine AD status; to determine this we ran our model with cfssDNA as single variable and a separate analysis where age of onset and sex were introduced as co-variants. Furthermore, nonparametric nominal regression was used to obtained Operating Characteristic (ROC) curve and area under the curve (AUC) value. Multivariance analysis was done to observe correlations of AD cases with Ab-42 and P-tau.
Results:
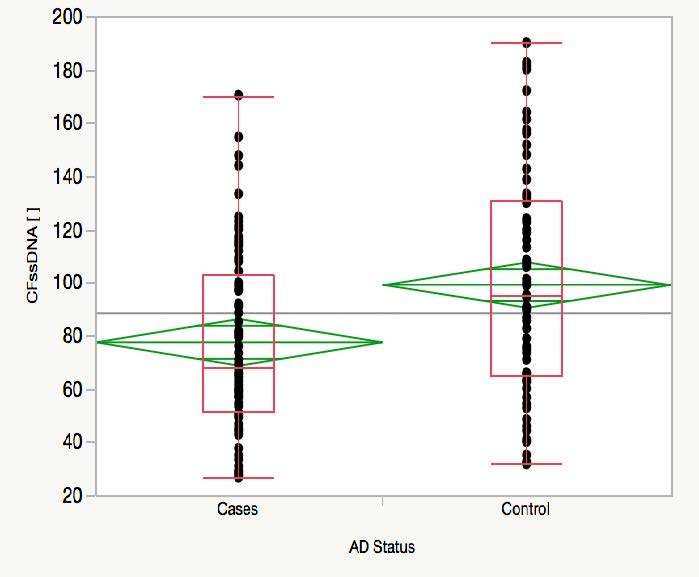
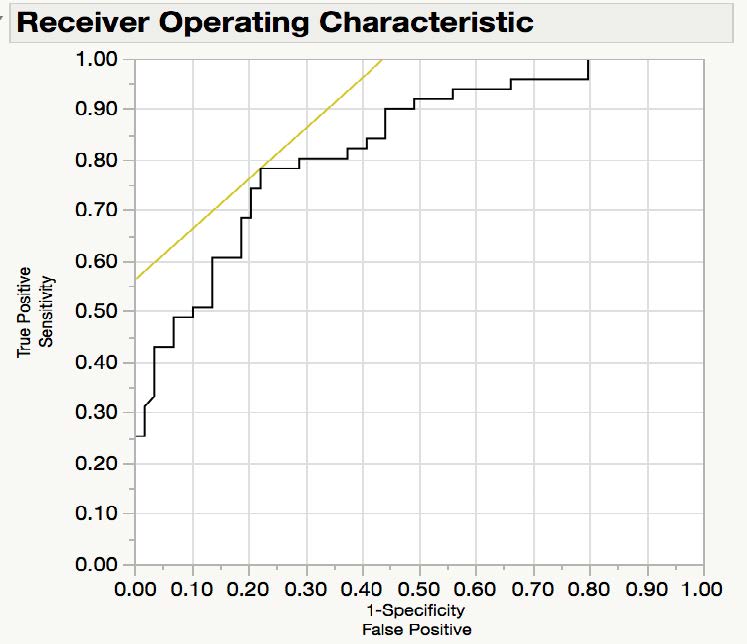
Hemocytometer assay protocol failed to detect cells present in CFS. Qubit assay showed detectable concentrations only for ssDNA. Paired T-test analysis determined that cfssDNA in AD cases is significantly lower than non-AD control, with a 2-tail p value of 0.0007 and a difference of mean of 21.66 ng/L. In addition, 95% confident intervals of the mean for AD cases range between 68.85ng/L and 86.4 ng/L; whereas in non-AD cases this range oscillate between 90.57 ng/L and 108ng/L. Nonparametric nominal regression analysis showed that cfssDNA is a significant variable for predicting AD status, the significance of prediction increases when age of onset and sex are introduced as co-variants (X2 p-value 0.0273). Finally, the ROC curve had an AUC of 0.82901. These results were consistent regardless if cohorts were analyzed independently or combined.
Discussion:
Hemocytometer measurements failed to detect cells present in CSF. This is consistent with previous literature reviews indicating that normal cell count in CSF does not exceed five cell per mL [13]. Therefore, we can infer that any nuclei material extracted from CSF samples originates from a cell free source. These results demonstrate that AD cases have significantly lower cfssDNA concentration than controls. All three datasets had AUC of greater than 0.80, this is comparable to the AUC that is observed with Ab42 and P-tau in other reports. As measurement of cfssDNA concentration is cheap, reliable and easy to conduct, cfssDNA may represent a meaningful and cost-effective biomarker for AD. Further studies of the sensitivity of this measurement are required to further establish CFssDNA as a biomarker for AD and compare it to other potential biomarkers for AD such as Ab42 and pTau.
Table 1. Demographic description of Swedish 1 and 2 and Italian cohort.
Table 2. paired t-test, X2 nonparametric nominal regression
Image 1. A) Distribution of cfssDNA concentration (ng/L) by AD cases and non-AD cases. B) Receiver Operating Characteristic curve (AUC = 0.82901)
Works Cited:
1. Höglund, K., et al., Alzheimer’s disease — Recent biomarker developments in relation to updated diagnostic criteria. Clinica Chimica Acta, 2015. 449: p. 3-8.
2. Dubois, B., et al., Research criteria for the diagnosis of Alzheimer’s disease: revising the NINCDS–ADRDA criteria. The Lancet Neurology, 2007. 6(8): p. 734-746.
3. Johansson, P., et al., Cerebrospinal fluid biomarkers for Alzheimer’s disease: diagnostic performance in a homogeneous mono-center population. Journal of Alzheimer’s Disease, 2011. 24(3): p. 537-546.
4. Landau, S.M., et al., Comparing predictors of conversion and decline in mild cognitive impairment. Neurology, 2010. 75(3): p. 230-238.
5. Fagan, A. and R. Perrin, Upcoming candidate cerebrospinal fluid biomarkers of Alzheimer’s disease. Biomark Medical, 2013. 6(4): p. 455-476.
6. G.M., S., et al., The Clinical Use of Cerebrospinal Fluid Biomarkers for Alzheimer’s Disease Diagnosis: The Italian Selfie. Journal of Alzheimer’s Disease, 2017. 55(4): p. 1659-1666.
7. Suzuki, N., et al., Characterization of circulating DNA in healthy human plasma. Clinica Chimica Acta, 2008. 387(1-2): p. 55-58.
8. Alegre, E., et al., Circulating Biomarkers in Malignant Melanoma. Advances in Clinical Chemistry, 2015. 69: p. 47-89.
9. Diaz Jr., L.A. and A. Bardelli, Liquid biopsies: Genotyping circulating tumor DNA. Journal of Clinical Oncology, 2014. 32(6): p. 579-586.
10. Podlesniy, P., et al., Low cerebrospinal fluid concentration of mitochondrial DNA in preclinical Alzheimer disease. Annals of Neurology, 2013. 74(5): p. 655-668.
11. Pyle, A., et al., Reduced CSF mitochondrial DNA is a biomarker for early-stage Parkinson’s disease. Annals of Neurology, 2015. 38: p. 216.e7-216.e10.
12. Cervera-Carles, L., et al., Cerebrospinal fluid mitochondrial DNA in the Alzheimer’s disease continuum. Neruobiology of Aging, 2015. 53: p. 192.e1-192.e4.
13. Sakka, L., G. Coll, and J. Chazal, Anatomy and physiology of cerebrospinal fluid. Eur Ann Otorhinolaryngol Head Neck Dis, 2011. 128(6): p. 309-16.


