Tyler Mower and Dr. John Kauwe, Department of Biology
Dipti Jigar Shah1, Frederick Rohlfing2, Swati Anand1, W. Evan Johnson3, MeiHwa Tanielle Bench Alvarez1, Jesse Cobell2, Jackson King2, Sydney A. Young1, John S. K. Kauwe2, Steven W. Graves1,*
1Department of Chemistry and Biochemistry, Brigham Young University, Provo, UT, 2Department of Biology, Brigham Young University, Provo, UT, 3Division of Computational Biomedicine, Boston University School of Medicine, Boston University, Boston, MA
Brief Title: Serum proteomic AD biomarkers
*Corresponding Author: Dr. Steven W. Graves, Department of Chemistry and Biochemistry
ABSTRACT
Background: Alzheimer’s disease (AD) remains challenging to diagnose, especially early disease. Useful serum AD biomarkers would be of great utility in clinical settings and in drug development efforts. We used a novel serum proteomic approach to interrogate the lowmolecular- weight proteome for AD biomarkers.
Experimental design: A discovery study used sera from 58 any-stage AD cases and 55 controls analyzed by capillary liquid chromatography-tandem mass spectrometry. Promising biomarkers were retested in a second, blinded confirmatory study (AD cases=68, controls=57). Several biomarkers replicated and multi-marker sets were modeled.
Results: The initial study found 59 potential AD biomarkers. Thirteen recurred in more than one multi-marker panel. In the blinded, confirmatory study, these 13 biomarkers were retested in separate specimens. Four markers validated comparing controls to patients with any-stage or very early AD.
Conclusions: We identified 4 serum biomarkers with replicable ability to diagnose AD. These results suggest the utility of this approach.
1. BACKGROUND
Alzheimer’s disease (AD) is the sixth leading cause of death in the US and is predicted to become 3 times more prevalent by 2050 (Alzhiemers Assoc., 2013). AD is a fatal disease without cure or treatment. This absence of therapy is largely due to the inability to diagnose AD early. Therapeutics are less likely to be useful as the characteristic tissue pathology becomes more extensive. These changes include β-amyloid protein (Aβ) plaque development and often neurofibrillary tangles of tau protein (Iqbal and Grundke-Iqbal, 2008).
At present, diagnosis of early stage AD remains problematic. The most promising biomarkers have been those identified in cerebrospinal fluid (CSF) and include reduced levels of Aβ-42 found in many but not all individuals with AD (Sunderland et al. 2003, Hu et al. 2007). Also, increased CSF levels of tau protein (tau) or phosphorylated tau (P-tau) are observed in many subjects with AD, more often with advanced disease. These changes are not entirely specific to AD (Blennow, 2004). The combination of low CSF Aβ-42 and increased tau or P-tau may predict disease progression (Hansson, 2006). Yet, levels of Aβ-42, tau and P-tau in patients with very mild AD are frequently indistinguishable from controls and their use in predicting or diagnosing very early AD would be challenging (Ringman et al. 2012).
There have been improvements in CSF-introduced, PET ligands that bind Aβ aggregates in the brain, diagnosing AD better and earlier. These ligands seem to overcome much of the insensitivity of CSF-based biochemical markers. Their ability to detect very early AD universally remains to be established. This is still debate as to whether aggregating Aβ-42 is the initiating pathological event or the sole mediator of AD progression (Selkoe, 2000). However, even if CSF-introduced imaging agents are reliable, screening the extraordinarily large population of aging, and hence at-risk, individuals to assess asymptomatic disease would be difficult and expensive. For this a blood test for AD would be valuable.
Evidence suggests AD patients have some disruption of the blood brain barrier, enabling Aβ to enter the peripheral circulation (Deane and Zlokovic, 2007; Zipser et al. 2007; Lue et al. 2009). Not surprisingly, research seeking blood AD biomarkers has focused on Aβ-42, tau, and P-tau. Unfortunately, existing studies find changes in these infrequently and to a lesser degree in serum compared with their performance in CSF (Watt et al. 2011).
Using an unbiased proteomics approach that considers all observable proteins to find serum or plasma AD biomarkers has been attempted (Zürbig and Jahn, 2012; Ghidoni et al. 2013; Lista et al. 2013 and references therein). With few exceptions approaches pooled serum from individuals with AD and pooled specimens from controls without AD and then performed two-dimensional gel electrophoresis (2DGE) on each pool then compared (Zhang et al. 2004; Lopez et al. 2005; Liu et al. 2006; Hye et al. 2006; German et al. 2007; Liao et al. 2007; Akuffo et al. 2008; Cutler et al. 2006; Thambisetty et al. 2010; Henkel et al. 2012). Spots that appeared quantitatively different were typically identified by matrix-assisted laser desorption ionizationmass spectrometry (MALDI-MS). In a number of these reports a second confirmatory study was conducted using immunoassays to measure the candidate biomarkers. However, 2DGE is frequently limited to high abundance proteins and method reproducibility is difficult (Gygi et al. 2000; Zhang et al. 2010). The results of AD biomarker studies using 2D-GE proteomics studies can be summarized as follows: The markers found in the 2DGE discovery phase with few exceptions were no longer different in the validation phase. Further, there were not consistent AD markers across studies (Lopez et al. 2005; Liu et al. 2006; Hye et al. 2006; German et al. 2007; Liao et al. 2007; Akuffo et al. 2008; Cutler et al. 2006; Thambisetty et al. 2010; Henkel et al. 2012). These results should not be interpreted as an absence of blood AD biomarkers, but rather a reflection of the insensitivity and poor reproducibility of 2DGE.
Shotgun proteomic approaches, e.g. MUDPIT, are used in detailing the complement of proteins present in a tissue or cell (Vaudel et al. 2012), but do not work well for quantitative comparisons.
Recently, a metabolomics/lipidomics approach was used as part of a partially prospective study of AD (Mapstone et al. 2014). In this group’s discovery phase metabolites, including amino acids, serotonin, DOPA, certain acyl-carnitines and certain phosphatidylcholines were found to be different in controls versus a group of 18 non-cognitively impaired subjects that later converted to MCI or mild AD. They developed a separate panel of 10 lipids that were significantly different between non-converting controls versus phenotype-converting subjects. This was tested in a validation study of 10 converters and the panel continued to discriminate well between normal controls and mild cognitive impairment or mild AD patients. Results for the metabolites and amino acids that had useful markers in the discovery set were not reported. This study seems promising but the numbers were few and the results unconfirmed by others.
Here we applied another global serum proteomics approach that interrogates the low abundance, low molecular weight molecules in serum (Merrell et al. 2004; Merrell, 2009; Esplin et al. 2011). This approach has been successfully applied to other clinical indications (Esplin et al. 2011). When applied to serum, it routinely surveys ~8,000 species (Alvarez and Shah, 2013). We hypothesized that this method, in conjunction with appropriate biostatistical analyses, would provide useful panels of serum biomarkers for AD diagnosis.
2. METHODS
2.1 Study Population
For both the initial and confirmatory studies, serum specimens were obtained from the Knight Alzheimer’s Disease Research Center (Knight ADRC) at the Washington University School of Medicine, St. Louis, MO. Institutional Review Board (IRB) approval had been previously obtained at Knight ADRC allowing specimens to be further studied. IRB approval was also obtained at BYU for specimen analysis. Specimens analyzed were coded without personal information.
In the initial, discovery study, sera from 58 cases and 55 controls were analyzed. Specimens were selected randomly by personnel at Knight ADRC. AD cases represented different clinical dementia ratings (CDR): mild cognitive impairment (MCI) or very mild AD (CDR 0.5, n=7), mild AD (CDR 1, n=4), moderate AD (CDR 2, n=19) and severe AD (CDR 3, n=28). Controls (CDR 0, n=55) were matched to AD cases for gender, age and ApoE4 status (a genetic risk factor for AD). Cases and controls did not have co-morbidities, including diabetes. Specimens when collected were allowed to clot for 30 min, then immediately centrifuged and serum aliquoted and frozen. Specimens were maintained at -80oC until analyzed at BYU. At BYU specimens were stored at -80°C, pre and post processing.
A second, confirmatory study of promising biomarkers from the discovery study was carried out with additional specimens provided by Knight ADRC. A set of 125 previously unanalyzed serum samples was provided, including 68 AD cases and 57 controls from nondemented subjects matched for age and gender. The 68 cases included n=24 CDR 0.5, n=23 CDR 1, and n=21CDR 2. The choice to include more subjects with early stage disease was by design to allow assessment of biomarkers for very early stage AD. This comparison was not possible in the discovery study due to small numbers. An independent arbiter, not part of the analysis team but aware of case/control status, created analysis sets that included both cases and controls randomized and submitted to our laboratory for analysis in a blinded fashion. In all, 11 sets of 10-13 sera each were analyzed. Each set had approximately the same number of cases and controls as well as a similar number of men and women to avoid batch effects. All MS results were provided to the arbiter for statistical analysis without breaking the blind.
2.2 Specimen Processing
Serum contains ~30 highly abundant proteins which cause mask other molecules suppression when analyzed by MS. To markedly increase the number of biomolecules in serum interrogated by MS, high abundance proteins were removed as described previously (Merrell, 2009; Alvarez and Shah, 2013; Merrell et al. 2009; Merrell et al. 2008). This sacrifices most proteins but allows several thousand otherwise unobservable small proteins, peptides, lipids and other biomolecules to be studied by MS.
2.3 Proteomic Analysis
Capillary liquid chromatography (cLC) was used to fractionate protein-depleted serum by gradient elution using an aqueous phase of 98% H2O, 2% acetonitrile, 0.1% formic acid and an organic phase of 2% H2O, 98% acetonitrile, 0.1% formic acid. A 1 mm (16.2 μL) microbore guard column (Upchurch Scientific, Oak Harbor, WA) and a 15 cm x 250 μm i.d. capillary column were employed in the cLC step. The columns were packed with POROS-R1 reversedphase media (Applied Biosystems, Framingham, MA). Using a flow rate of 5.0 μL/min, the gradient began with 3 min 95% aqueous/5% organic phase, followed by an increase in organic phase to 60% over 24 min. The organic phase was then increased to 95% over 7 min, held at for 7 min and returned to initial conditions over 5 min and maintained there to re-equilibrate the column.
The cLC was interfaced through an IonSpray source to a QSTAR Pulsar I quadrupole, time-of-flight tandem mass spectrometer used in positive ion mode (Applied Biosystems). MS data was collected from m/z 500-2500 from 5-55 min elution at a scan rate of 1 spectrum/sec. Analyst QS® allowed for data collection, mass spectra comparison and analysis. Each set was processed and analyzed by MS during a single day.
Tandem MS with fragmentation to chemically identify biomarkers was accomplished using the same tandem MS as described previously (Alvarez, 2013).
Between the first and second studies, the mass spectrometer required replacement. For the blinded, follow-up study specimens were processed as described but analyzed using an Agilent 6530 Accurate-Mass Q-TOF LC/MS system. Both instruments are ESI-Q-TOF-MS-MS instruments, although the newer instrument is reported to be more sensitive. Again one set of specimens was analyzed in a single day.
For the second study, an Agilent 1260 Infinity Series HPLC system was used, equipped with the same column and analytical columns using the same packing. The loaded amount (5 μg), flow rate and gradient were identical to those used in the initial study. The ESI source was operated in positive ion mode and MS scans were collected 8 spectra/s from m/z 400–3200. MassHunter Data Acquisition B.05.01 (Agilent) and MassHunter Qualitative Analysis B.06.00 (Agilent) permitted data collection, specific ion extraction and post hoc analysis.
2.4 MS Data Analysis
Ten endogenous species, occurring every 2-3 min in the cLC chromatogram, were used for normalizing chromatographic times (Alvarez, 2013). In the discovery study, spectra were aligned using these peaks and 2 min windows created around each time marker. Then comparison groups were color coded, overlaid and analyzed for peaks differing in abundance (>1.5x) (Esplin et al. 2011). Differences were determined first visually and then using instrument software to provide peak height in ion counts which were evaluated statistically between cases and controls using Student’s t-test. Molecular species that were statistically significant were considered candidate biomarkers.
Potential biomarkers were submitted to additional statistical analysis. To compensate for the non-biologic variability between samples, the peak intensity of a candidate species was ratioed to the intensity of a co-eluting species that was quantitatively comparable in specimens of cases and controls to reduce variability due to sample processing, loading, ionization efficiencies and instrument performance. Raw (un-normalized) and log-normalized values were calculated for each of the potential biomarkers. Those candidate biomarkers that continued to demonstrate statistical significance after normalization were further evaluated by receiver operator curve characteristic analysis to determine sensitivity and specificity.
Combinations of candidate AD biomarkers were modeled. Candidates with p-values less than 0.10 were also included because they may provide complementary diagnostic utility. Development of sets was accomplished using logistic regression analysis to model the log-odds of developing AD. A forward-selection procedure was used where each marker was considered testing the effects of adding other markers one at a time and combining the marker that increased the area under the curve (AUC) the most, then including that marker in the model, hence a ‘leave-one out’ prediction approach (Agresti, 2002). The algorithm stopped adding markers when no additional marker increased AUC of the combination by more than 0.03. Receiver operator characteristic (ROC) curves were again plotted and AUCs were calculated for the multimarker combinations.
3. RESULTS
3.1 Initial Discovery of Candidate Serum AD Biomarkers
The hypothesis predicted serum biomarkers useful in the diagnosis of AD could be found. A novel serum proteomic approach was employed that focused on the low molecular components in serum. Using raw, un-normalized mass spectral data, 44 candidate serum AD biomarkers were found that were statistically significant comparing any stage AD (CDR 0.5-3) to non-demented controls (CDR 0). Another 25 biomarkers showed quantitative differences between cases and controls having near-significant p-values between 0.05 and 0.10. After log normalization of each candidate to an endogenous control, the number of biomarkers was reduced to 38 significant and 21 near-significant candidates (p=0.05 to <0.10). All biomarkers significant after normalization had been significantly or near significantly different in the unnormalized results. Candidate biomarkers were further evaluated by logistic regression analysis, leading to ROC curves, providing AUCs and sensitivities and specificities. Some biomarkers were increased in AD while others decreased. The best serum AD biomarker provided an AUC of 0.645. Samples from cases and controls were always run together, although batches were run on different days. When the data were clustered using a hierarchical algorithm, there were no batch effects. Likewise, cluster analysis did not find any gender bias.
3.2 Evaluation of the Panels of Biomarkers in Initial Study
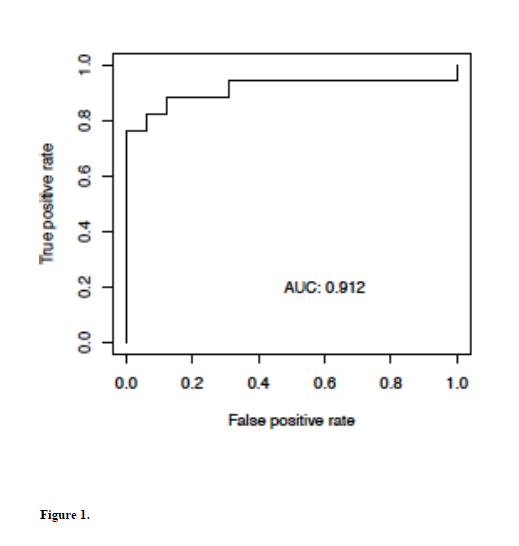
Combinations of serum biomarkers, evaluated as described above, identified markers that appeared in multiple models, suggesting they may be more promising. Thirteen biomarkers appeared in 10% or more of all multi-marker models (Table 1). When reanalyzed as a subset, the best combination provided an AUC of 0.912 (Fig 1) with a sensitivity of 88% at a specificity of 87%. Five additional multi-marker sets provided AUCs >0.80.
3.3 Confirmation Study of Previously Found Biomarkers
The second confirmation study focused on how these 13 biomarkers would perform in a separate set of specimens analyzed in a blinded fashion. This set included 68 cases, many having a CDR of 0.5, and 57 controls, matched for age and gender. Of the 13 AD biomarker candidates, the biomarkers m/z 708.3 and 660.4 could not be clearly evaluated due to ion suppression and/or unrelated overlapping peaks.
The raw extracted MS data obtained for the remaining biomarkers was sent to the independent arbiter who conducted statistical analyses and maintained the blind. The data was tested in four ways: i) controls vs any-stage AD cases; ii) controls vs CDR >0.5; iii) controls vs moderate AD (CDR 2); and finally iv) controls vs very early AD only.
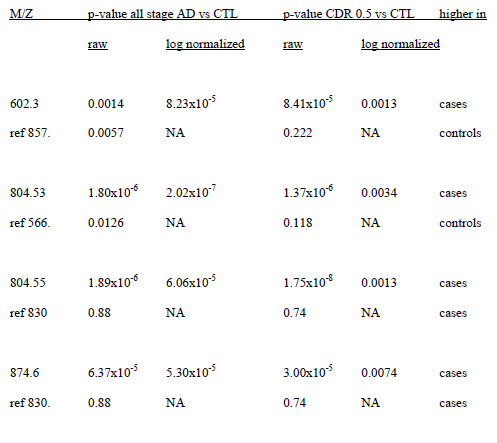
Among the remaining 11 biomarkers, m/z 602.3, 804.55 and 874.6 were significantly different between cases and controls for all 4 comparisons with the same trend as observed in the original study.
As we reviewed data from the initial study, we found that there were 2 candidate biomarkers with the same nominal m/z of 804.5, but offset somewhat in elution time. To insure that there was no misinterpretation of the data, both species were included. The second species had an m/z of 804.53 and eluted somewhat later. This species had been a significant biomarker in the initial study but was not in the subset of 13. This candidate also validated. A summary of the performance of these 4 biomarkers is provided in Table 3.
In the initial study candidate peaks had been normalized to endogenous controls. These 4 validating candidates were normalized to endogenous controls used in the first study. All 4 candidates were still significantly different (Table 4).
3.4 Identification of the Validated Biomarkers
The 4 biomarkers that validated in the replication set were characterized by tandem MS. One of these was a peptide and 3 were glycerophosphatidylcholines. Structural features obtained from MS-MS studies are summarized as follows:
Biomarker 602.3 (z=1) was a peptide with an amino acid sequence of L/IAENR. The parent protein cannot be unambiguously identified as this sequence is found in multiple proteins.
Biomarker 804.55 (z=1, elution 33-35 min) was a phosphatidylcholine with two fattyacyl side chains, one with 18 carbon atoms and 2 double bonds (18:2) and the other having 20 carbon atoms and 5 double bonds (20:5). Positions of double bonds cannot be determined by MS. A fragment at m/z=542.321 suggests the loss and hence presence of a fatty acid (18:2) and a fragment at m/z=520.334 affirms the presence of a fatty acid (20:5). The molecular formula was [C46H78NO8P]+H+.
Biomarker 874.6 (z=1) was a peroxidated phosphatidylcholine. Previous research this molecule to be a PC (38:4)-(OOH)2 (Ingram et al. 2003). It was oxidatively modified to contain a bis-peroxide of one fatty acid (20:4) plus an unmodified second fatty acyl group (18:0). The elemental composition was C46H84NO12P. Given the saturated nature of the one fatty acid (18:0), it is almost certain that the second, oxidized fatty acid was arachidonic acid (20:4).
Biomarker 804.53 (z=1) elution 39.5-41.5 min was an oxidized glycerophosphatidylcholine of formula C42H78NO11P+H+. There were three primary possible structures: 1-palmitoyl-2- (14,15-di-hydroxy-9-keto-10, 12-octadecadienoyl) glycerophosphatidyl choline; 1-palmitoyl-2- (13,14-di-hydroxy-10-keto-8, 11-octadecadienoyl) glycerophosphatidyl choline; or 1-palmitoyl-2- (13-hydroperoxy-8-keto-9, 11-octadecadienoyl) glycerophosphatidyl choline. Again, palmitic acid is one of the fatty acyl groups and less prone to oxidation. The second fatty acid (18:2) has likely been oxidized (Pereira, 2006).
3.5 Constructing Multi-marker Diagnostic Panels for AD
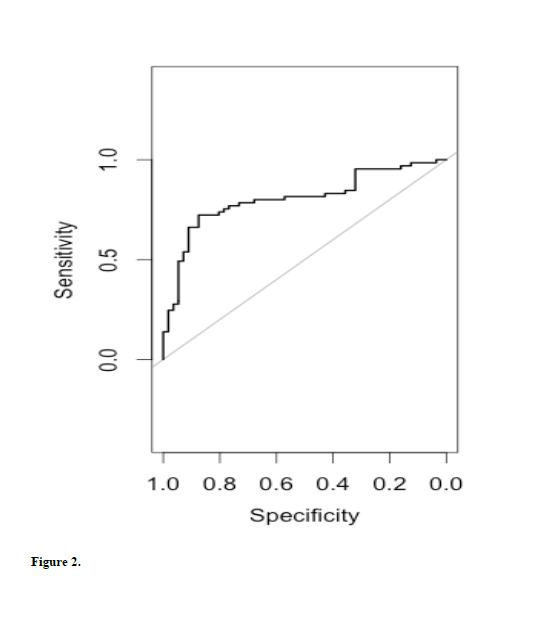
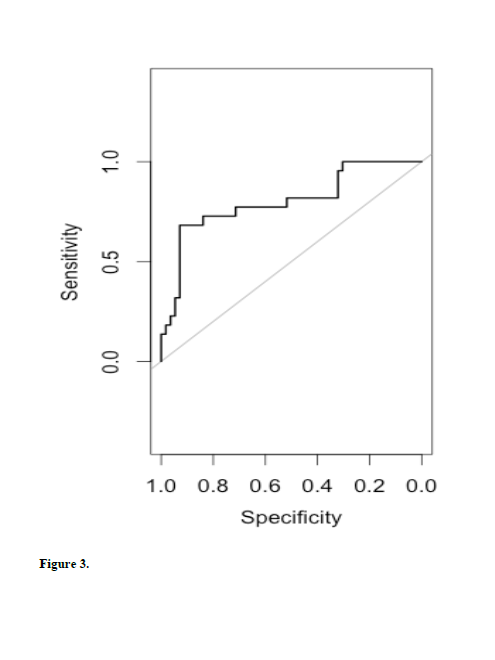
For the four validated markers, logistic regression analysis was sufficient to test multimarker sets diagnosing AD. Statistics were carried out for controls versus any-stage AD and for controls versus very early AD (CDR=0.5). All possible combinations were considered. Analysis provided ROC curves, AUCs, sensitivities and specificities. When comparing controls (CDR 0) vs any-stage AD (CDR 0.5, 1.0, 2.0), the best model included all four biomarkers (AUC=0.805, See Fig 2). When comparing controls to very mild AD (CDR 0.5), the best combination of biomarkers included m/z 602.3, 804.53, and 874.6 (AUC=0.817, Fig 3).
4. DISCUSSION
The hypothesis was that a proteomic approach focused on low molecular weight serum components could find biomarkers that identified individual with AD. Our initial study found several species significantly different between cases and controls. Combinations of these provided a model with 88% sensitivity and 87% specificity. These results were promising.
Any proteomic approach is dependent on the quality of specimens available for analysis. Specimens were obtained from the Knight Alzheimer’s Disease Research Center at Washington University School of Medicine which has stringent criteria for AD diagnosis and classification. Cases and controls were matched for age, gender, the proportion of subjects carrying the ApoE4 allele, and study center in the initial study. The second study included more subjects with very early AD (CDR 0.5) and were matched for age and gender. In the follow up study 56.6% of cases had at least one copy of the ApoE4 allele compared with 31.8% of controls. This may have introduced differences, but the 4 biomarkers that replicated were different in subjects in the first study who were matched for ApoE4. Cases and controls for both studies were without comorbidities, making biomarkers more representative of AD and not other diseases. While the candidate biomarkers likely reflect changes occurring in AD, we cannot, at this time, rule out the possibility that some of these serum markers might be changed in other neurologic or more general medical conditions.
In our approach we deliberately excluded highly abundant, higher molecular weight proteins that mask smaller and less abundant species. We recognize that potentially informative species may have been lost in this approach. Nevertheless, our approach allowed for the survey of >8000 low molecular weight species and though limited to this subset of serum molecules, it appears to provide many candidate biomarkers for AD. This same serum proteomic method has been successful in defining candidate biomarkers for other medical indications (Alvarez and Shah, 2013).
Of the 13 most promising biomarkers in the first study, 5 appeared to be peptides, the balance lipids. Of these, 4 were validated in the second study. Extensive investigation of their chemical nature was conducted. The sequence of the one peptide was determined but was too small to assign to a parent protein unambiguously. The other 3 biomarkers were glycerophosphatidyl cholines. The fatty acid side chain carbon number and double bond number cannot be specified by MS and comparison databases for lipid fragmentation data do not exist. Alternative methods, e.g. NMR, to completely characterize lipid structure are unusable at the concentrations available. Two of the lipids represented oxidized species, suggesting strongly the action of reactive oxygen species. The observation of differences in these lipids in both very early AD and in later stages suggests that ROS-related changes arise very early in AD pathology. None of these lipids was described in the recent work of Mapstone et al. (2014) but given the different processing and the use of cLC-tandem MS this is not surprising.
We performed simple statistical analyses on both normalized and un-normalized sets of data to determine all the significant and near significant biomarkers that might be considered. Near significant species were considered because they might be diagnostically useful for a subset of patients and would be complementary to other markers as part of a set. We found more potential markers when using the raw, un-normalized data. All of the potential biomarkers found after normalization to an endogenous species in the serum were represented among the unnormalized biomarker candidates. The rationale was that such a species would be subject similarly to fluctuations in ionization efficiency, sensitivity, baseline noise, processing inconsistencies, separation column performance, etc. The use of the reference should reduce variability. Previous studies had shown this approach to be somewhat superior to normalization to total ion counts, a common normalization strategy (Alvarez and Shah, 2013). Normalization to reference standards was not an option given that none of the relevant biomarkers were identified at the outset of the experiments. In these studies, it was difficult to find an ideal endogenous reference species and sometimes the reference did not reduce the relative variability. Nevertheless, we consistently applied this approach across both studies, but for this reason we have presented both normalized and un-normalized data.
In the initial study combined sets or panels of biomarkers were constructed using a ‘leave one out’ forward selection model in conjunction with logistic regression analyses. This allowed for combinations of the many candidate biomarkers to be modeled. This employed normalized data and identified several combinations of markers that provided improved sensitivities over those of single markers. Four of these provided sensitivities of 95% or better with a sensitivity of at least 80% in the initial study. However, thereafter, we limited additional analyses to those markers that appeared in at least 10% of all the models. Considering just these 13 biomarkers, there were still 6 panels with AUCs >0.80, two having AUCs above 0.90, providing ~85% sensitivity with ~85% specificity. In the replication study, it was unnecessary to repeat the leave-one-out approach because there were just 4 candidates to be modeled. Using logistic regression analyses on those 4 markers, 3 combinations provided AUC values greater than 0.80 with 2 additional having AUCs of 0.79 comparing controls to any stage AD and very similar findings for controls versus CDR 0.5 patients. Sensitivities were ~75-78% with specificities of 80-98%. These confirmatory results suggest that this approach was successful.
Only 13 of 59 candidate biomarkers were considered in the replication study. It is possible that some of the 46 additional markers will validate and contribute to improved diagnostic sensitivity in combination with the 4 currently validated markers. This will require substantial additional analysis. Further, it would be interesting to include data on CSF amyloid beta (1-42), tau protein or P-tau protein levels or ligand studies to determine if the biomarkers found here correlate or are complementary to those. However, it is unknown if the subjects studied here have existing CSF markers.
In summary, this serum proteomic approach appeared capable of finding novel candidate biomarkers for AD. Some of these markers individually appeared to be useful diagnostically, but multi-marker models appeared to diagnose a larger portion of AD patients, including very early AD subjects. The markers characterized and identified provide some potential biological insights into early events in AD. While the discovery and validation results are promising, additional studies are required to confirm the clinical utility of these biomarkers.
Disclosure statement
All authors declare no conflicts. Written informed consent was obtained from all participants.
Acknowledgements
We gratefully acknowledge the Knight Alzheimer’s Research Centre at Washington University School of Medicine for providing the serum samples. We are also grateful for the contribution of several postdoctoral fellows and students who participated in aspects of the work. These include Dr. Karen Merrell, Trent Tipton, Taylor Turnbull, Jordan Salmon, Ryan Egbert, Jeff Olson, Matthew Ellsworth, Casey Stinnett, Spencer Ruben, Tyler Mower, Hunter Schone, Hunter Wright, and Tasha McGhie.
Funding for this work came from a Technology Transfer Bridging Grant, a College of Physical and Mathematical Sciences CHIRP grant and external funds made available through the Technology Transfer Office, all at Brigham Young University.
Key Words: Alzheimer’s disease; serum biomarkers; mass spectrometry; diagnosis; proteomics; lipidomics
References
Agresti A. An introduction to categorical data analysis, 2nd Ed, New York, Wiley, 2002.
Akuffo EL, Davis JB, Fox SM, Gloger IS, Hosford D, Kinsey EE, et al. The discovery and early validation of novel plasma biomarkers in mild-to-moderate Alzheimer’s disease patients responding to treatment with rosiglitazone. Biomarkers 2008;13:618-36.
Alvarez MTB. Exploration of the low-molecular weight proteome of tissue and serum, with applications to disease biomarker discovery. Dissertation, Department of Chemistry and Biochemistry, Brigham Young University. 2013;1-182.
Alvarez MTB, Shah DJ, Thulin CD, Graves SW. Tissue proteomics of the low-molecular weight proteome using an integrated cLC-ESI-QTOFMS approach. Proteomics 2013;13:1400-11.
Alzhiemers Assoc. 2013 Alzheimer’s disease facts and figures. Alzheimers Dement 2013;9:1-71.
Blennow K. Cerebrospinal fluid protein biomarkers for Alzheimer’s disease. NeuroRx® 2004;1:213-25.
Cutler P, Akuffo EL, Bodnar WM, Briggs DM, Davis JB. Proteomic identification and early validation of complement 1 inhibitor and pigment epithelium-derived factor: two novel biomarkers of Alzheimer’s disease in human plasma. Proteomics Clin Appl 2006;2:467-77.
Deane R, Zlokovic BV. Role of the blood-brain barrier in the pathogenesis of Alzheimer’s disease. Curr Alzheimer Res 2007;4:191-7.
Esplin MS, Merrell K, Goldenberg R, Lai Y, Iams JD, Mercer B, et al. Proteomic identification of serum peptides predicting subsequent spontaneous preterm birth. Am J Obstet Gynecol 2011;204:391-98.
German DC, Gurnani P, Nandi A, Garner HR, Fisher W, Diaz-Arrastia R, et al. Serum biomarkers for Alzheimer’s disease: proteomic discovery. Biomed Pharmacother 2007;61:383-89.
Ghidoni R, Paterlini A, Benussi L. Translational proteomics in Alzheimer’s disease and related disorders. Clin Biochem 2013;46:480-86.
Gygi SP, Corthals GL, Zhang Y, Rochon Y, Aebersold R. Evaluation of two-dimensional gel electrophoresis-based proteome analysis technology. Proc Natl Acad Sci 2000;97:9390-95.
Hansson O, Zetterberg H, Buchhave P, Londos E, Blennow K, Minthon L. Association between CSF biomarkers and incipient Alzheimer’s disease in patients with mild cognitive impairment: a follow-up study. Lancet Neurol 2006;5:228-34.
Henkel AW, Muller K, Lewczuk P, Muller T, Marcus K, Kornhuber J, et al. Multidimensional plasma protein separation technique for identification of potential Alzheimer’s disease plasma biomarkers: a pilot study. J Neural Transm 2012;119:779-88.
Hu Y, Hosseini A, Kauwe JS, Gross J, Cairns NJ, Goate AM, et al. Identification and validation of novel CSF biomarkers for early stages of Alzheimer’s disease. Proteomics Clin Appl 2007; 1:1373-84.
Hye A, Lynham S, Thambisetty M, Causevic M, Campbell J, Byers HL, et al. Proteome-based plasma biomarkers for Alzheimer’s disease. Brain 2006;129:3042-50.
Ingram PR, Homer NZ, Smith RA, Pitt AR, Wilson CG, Olejnik O, Spickett CM. The interaction of sodium chlorite with phospholipids and glutathione: a comparison of effects in vitro, in mammalian anc in microbial cells. Arch Biochem Biophys 2003;410:121-133.
Iqbal K, Grundke-Iqbal I. Alzheimer neurofibrillary degeneration: significance, etiopathogenesis, therapeutics and prevention. J Cell Mol Med 2008;12:38-55.
Liao P-C, Yu L, Kuo C-C, Lin C, Kuo Y-M. Proteomics analysis of plasma for potential biomarkers in the diagnosis of Alzheimer’s disease. Proteomics Clin Applic 2007;1:506-12.
Lista L, Faltraco F, Prvulovic D, Hampel H. Blood and plasma-based proteomic biomarker research in Alzheimer’s disease. Prog Neurobiol 2013;101-102:1-17.
Liu H-C, Hu C-J, Chang J-G, Sung S-M, Lee L-S, Yuan R-Y, et al. Proteomic identification of lower apolipoprotein A-I in Alzheimer’s disease. Dement Geriatr Cogn Disord 2006;21:155- 61.
Lopez MF, Mikulskis A, Kuzdzal S, Bennett DA, Kelly J, Golenko E, et al. High-resolution serum proteomic profiling of Alzheimer disease samples reveals disease-specific, carrierprotein- bound mass signatures. Clin Chem 2005;51:1946-54.
Lue L-F, Walker GD, Jacobson S, Sabbagh M. Receptor for advanced glycation end products: its role in Alzheimer’s disease and other neurological diseases. Future Neurol 2009;4:166-77.
Mapstone M, Cheema AK, Fiandaca MS, Zhong X, Mhyre TR, MacArthur LH, Hall WJ, Fisher SG, Peterson DR, Haley JM, Nazar MD, Rich SA, Berlau DJ, Peltz CB, Tan MT, Kawas CH, Federoff HJ. Plasma phospholipids identify antecedent memory impairment in older adults. Nature Med 2014;20:415-18.
Merrell K. A top-down proteomic approach for the discovery of novel serum biomarkers of pregnancy-related disease. Dissertation, Department of Chemistry and Biochemistry, Brigham Young University. 2009;1-141.
Merrell K, Southwick K, Graves SW, Esplin MS, Lewis NE, Thulin CD. Analysis of lowabundance, low-molecular-weight serum proteins using mass spectrometry. J Biomol Tech 2004;15:238-48.
Merrell K, Thulin CD, Esplin MS, Graves SW. An integrated serum proteomic approach capable of monitoring the low molecular weight proteome with sequencing of intermediate to large peptides. Rapid Commun Mass Spectrom 2009;23:2685-96.
Merrell K, Thulin CD, Esplin MS, Graves SW. Systematic internal standard selection for capillary liquid chromatography-mass spectrometry time normalization to facilitate serum proteomics. J Biomol Tech 2008;19:320-7.
Pereira ALdRP. Identificacao de radicais livres e produtos de oxidacao de biomoleculas por MS. Dissertation, Universidade de Aveiro 2006.
Ringman JM, Coppola G, Elashoff D, Rodriguez-Agudelo Y, Medina LD, Gylys K, et al. Cerebrospinal fluid biomarkers and proximity to diagnosis in preclinical familial Alzheimer’s disease. Dement Geriatr Cogn Disord 2012;33:1-5.
Selkoe DJ. Toward a comprehensive theory for Alzheimer’s disease. Hypothesis: Alzheimer’s disease is caused by the cerebral accumulation and cytotoxicity of amyloid β-protein. 2000;924:17-25.
Sunderland T, Linker G, Mirza N, Putnam KT, Friedman DL, Kimmel LH, et al. Decreased betaamyloid 1-42 and increased tau levels in cerebrospinal fluid patients with Alzheimer disease. J Amer Med Assoc 2003;289:2094-103.
Thambisetty M, Simmons A, Velayudhan L, Hye A, Campbell J, Zhang Y, et al. Association of plasma clusterin concentration with severity, pathology, and progression in Alzheimer’s disease. Arch Gen Psychiatry 2010;67:739-48.
Vaudel M, Sickmann A, Martens L. Current methods for global proteomic identification. Expert Rev Proteomics 2012;9:519-32.
Watt AD, Perez KA, Faux NG, Pike KE, Rowe PB, Salvado O, et al. Increasing the predictive accuracy of amyloid-β blood-borne biomarkers in Alzheimer’s disease. J Alzheimers Dis 2011;24:47-59.
Zhang G, Annan RS, Carr SA, Neubert TA. Overview of peptide and protein analysis by mass spectrometry. Curr Protoc Protein Sci John Wiley & Sons, Inc.; 2010, 62:16.1.1–16.1.30.
Zhang R, Barker L, Pinchev D, Marshall J, Rasamoelisolo M, Smith C, et al. Mining biomarkers in human sera using proteomic tools. Proteomics 2004;4:244-56.
Zipser BD, Johanson CE, Gonzalez L, Berzin TM, Tavares R, Hulette CM, et al. Microvascular injury and blood–brain barrier leakage in Alzheimer’s disease. Neurobiol 2007;28:977-86.
Zürbig P, Jahn H. Use of proteomic methods in the analysis of human body fluids in Alzheimer research. Electrophoresis 2012;33:3617-30.
Figure legends
Figure 1. Best performing multimarker model from the initial study. Shown is an ROC curve produced for biomarkers 531.3, 1568.2, 804.6, 602.3 and 708.3 by logistic regression analysis. The AUC was 0.912 with a sensitivity of ~88% at a specificity of ~87%.
Figure 2. Receiver operator characteristic curve modeled on the 4 validated biomarkers m/z 602.3, 804.6, 874.6 and 804.5 using logistic regression analysis. The analysis compared controls (CDR=0) to any stage AD (CDR= 0.5, 1.0, 2.0). The AUC was 0.805 with a sensitivity of ~78% at a specificity of 80%.
Figure 3. Receiver operator characteristic curve modeled on three of the four validated markers, m/z 602.3, 804.53 and 874.59. The analysis compared controls with very early AD (CDR 0.5). The AUC was 0.817 providing a sensitivity of ~78% at a specificity of ~98%.
Table 1. Candidate serum AD biomarkers from initial study. Values were compared after log normalization to an endogenous species. Significant and near significant markers were considered when developing multi-marker models.
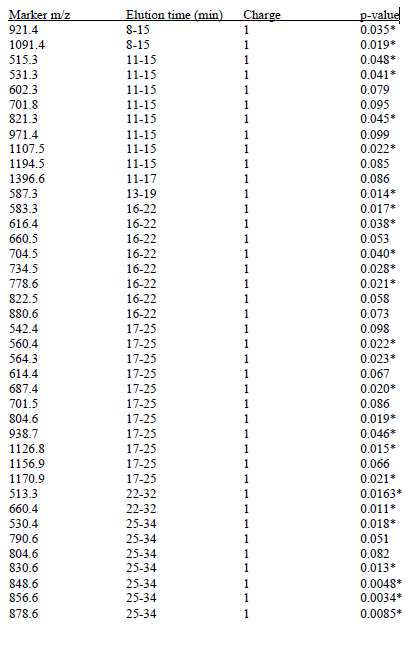
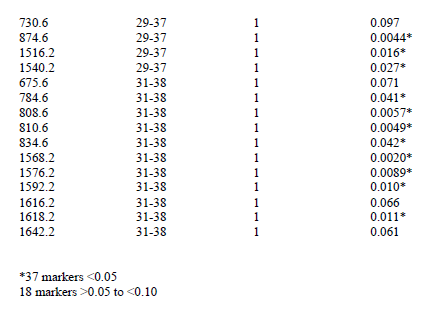
Table 2. Biomarkers that appeared in >10% of all the multi-marker models in initial study
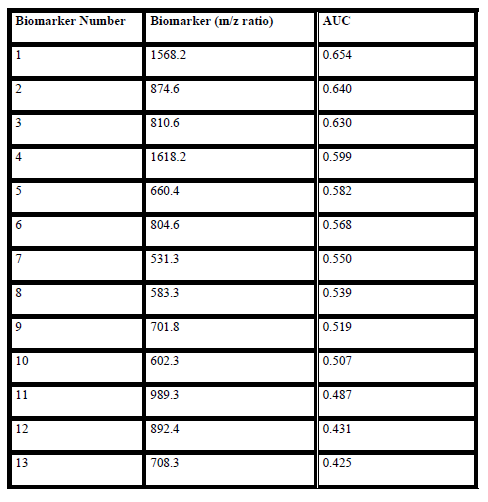
Table 3. Promising initial study biomarkers performance in the second study. Different stages were compared and p-values for them are listed. Observation was made if they followed the same or opposite trend. Finally, an indication is provided as to whether the biomarker replicated.
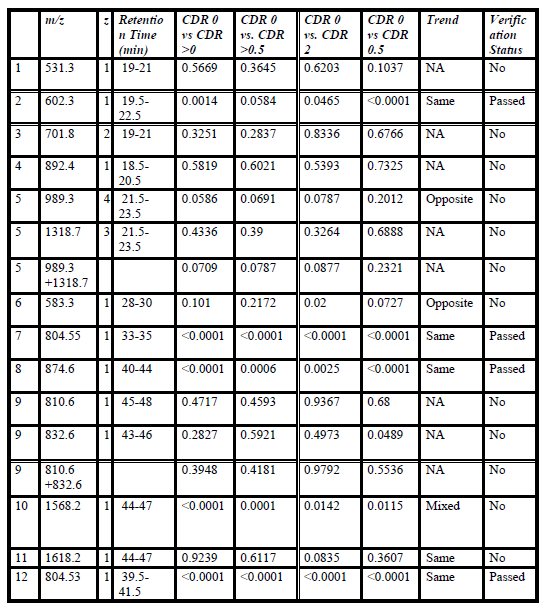
Table 4. Raw and normalized results for the 4 markers with continued utility in the second study. P-values are provided for statistical comparisons of all stage AD vs controls and CDR 0.5 vs controls. The reference used for normalization is also shown.