Brigham Barzee, Brett Gardiner, and Dr. Jon Wisco, Department of Physiology and Development Biology
Introduction
The purpose of this study is to analyze spatial co-localizations between amyloid beta (Aβ), tau, and iron in postmortem brains of Alzheimer’s disease (AD) and cerebrovascular disease (CVD) patients. Iron is readily visible in T2* magnetic resonance images (MRI), and has been shown to be spatially correlated with Aβ plaques in AD. Neurofibrillary tangles of tau protein are also associated with AD, and Aβ plaques are also found in the walls of the vessels in CVD. If iron co-localizes with Aβ, then the location of the iron—parenchyma vs. sulci—as seen in MRI could reveal if the disease is possibly AD or CVD, respectively. Hence, MRI could be used in the future as a tool for earlier diagnosis of either disease. We have imaged stains of iron, Aβ, and tau in hippocampus sections of 8 different brains, and we are using Adobe Photoshop and OlyVia (image analysis software) to create digital images of iron’s co-localization with Aβ and tau. While CVD samples have yet to show a clear correlation, preliminary results indicate that iron does indeed co-localize with both Aβ and tau aggregations in AD samples.
Materials and Methods
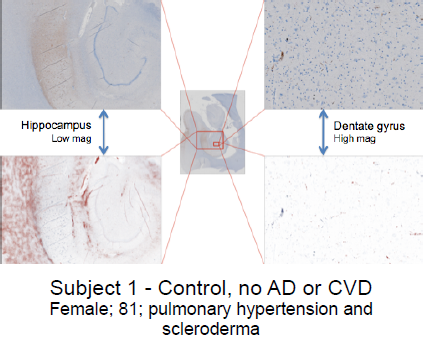
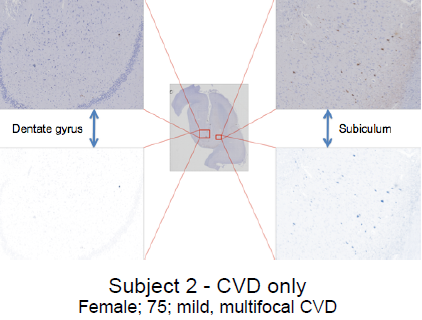
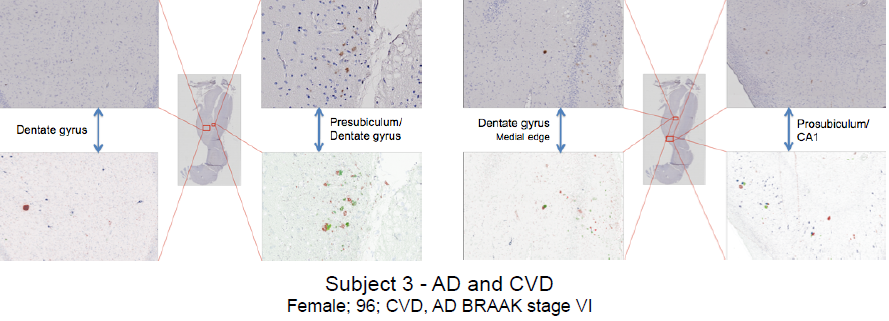
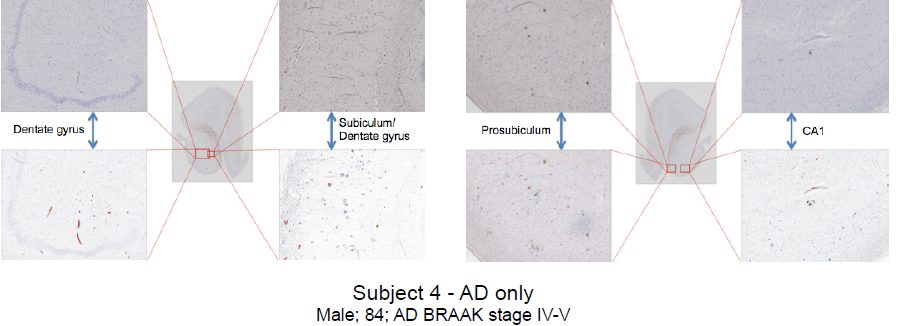
Tissue samples—AD only, AD and CVD, and CVD only (Subjects 1-4, see images below)—were obtained from David Geffen School of Medicine at UCLA. Three consecutive tissue sections (6 microns) were cut from each sample block (mostly in the region of the hippocampus) and mounted on slides. For each sample area, the three tissues sections were stained separately for Aβ, tau, and iron, respectively. Basic immunohistochemistry was used to stain Aβ and tau, and Prussian blue-DAB stain was used to accentuate iron deposits. High resolution images were captured under microscope as virtual slide images (VSI) to be viewed on a computer. An imaging software, OlyVia was used to manipulate magnified images so they could be accurately superimposed. Using Adobe Photoshop, stained areas were enhanced and recolored—green for Aβ, blue for tau, and red for iron. Digital images of stained areas were combined, revealing correlations between iron, Aβ, and tau at high magnifications in several areas of the hippocampus.
Results
Subject 1 exhibited virtually no correlations between iron, Aβ, and tau. In fact, anti-correlation is manifest between iron and tau at low magnification. Aβ is almost completely absent. In subject 2, only tau can be seen—iron and Aβ were virtually nonexistent in all areas of this hippocampus. Subject 3 showed strong co-localization between iron and Aβ in the area between the dentate gyrus and presubiculum, and near the medial edge of the dentate gyrus. Co-localization between iron, Aβ, and tau was evident in the prosubiculum-CA1 area. No correlation was seen in the center of the dentate gyrus. Subject 4 also showed no co-localizations in the center of the dentate gyrus. However, a strong correlation between iron and Aβ was visible in the area between the subiculum and dentate gyrus. Iron, Aβ, and tau all correlate strongly in the prosubiculum— which is also evident, but not as clear, in the CA1 region.
Discussion and Conclusion
These data provide strong evidence that iron and Aβ aggregations correlate spatially in the areas immediately surrounding the dentate gyrus of the hippocampus in postmortem AD brains. Tau appears to correlate with the same iron-Aβ aggregations, but only in some small areas. There appears to be no consistency regarding which areas of the hippocampus exhibit an iron-tau correlation. In many cases, iron-tau co-localization is more difficult to determine, because tau is much more abundant than iron or Aβ. The data suggest no correlations between iron, Aβ, and/or tau in the hippocampus of CVD-only patients—as iron and Aβ were virtually nonexistent in subject 2. Based on these conclusions, we have determined that iron can be used as a biomarker for AD, and MRI can therefore be used to more effectively diagnose the disease. The same cannot be said for CVD.
Acknowledgements
Grant Funding Sources: NIH/NIA 1 R21 AG037843-02, NIH/NCRR P41 RR013642-12S1, Translational Research Fund (UCLA), the McGinty Family Foundation, and BYU ORCA grant. Special thanks to Yi Huang, Spencer Tung, Alan Harker.