J. J. Joyal, L. D. Hansen, D. R. Coons, G. M. Booth, B. N. Smith and D. D. Mill
Introduction
Evolutionary fitness [1, 2] and physical activity [3] are related to the metabolic activity of organisms. The metabolic rate of an organism may be measured as the rates of CO2 or heat production, or of O2 consumption [4–6, 7]. Calorespirometric data on both heat and CO2 rates allows calculation of anabolic rates, calculation of efficiencies of conversion of substrate into anabolic products, and provides information on the nature of the substrate carbon source [6, 7]. In this study, heat and CO2 production rates of Musca domestica (Diptera: Muscidae) pupae were measured during exposure to varied humidity, temperature, decreasing O2 partial pressure, and to increasing CO2 partial pressure. Heat and CO2 rates were also measured as a function of development age.
Previous work on insect pupae has demonstrated the value of respirometric measurements in studying insect development. Gas exchange rates of Mediterranean fruit fly (Ceratitis capitata) pupae measured as a function of temperature were used to calculate respiratory quotients and specific heat rates [8]. Respiratory quotients varied inversely with temperature with values as large as 2.7 at low temperatures. Despite these high values, it was concluded that the substrate was carbohydrate. The calculated heat rates varied from 0.80 μW mg–1 at 35°C to 8.0 μW mg–1 at 35°C and increased with increasing age of the pupae. In other studies, the effects of exposure to cold temperatures on metabolism of M. domestica pupae at 26–28°C have been measured as O2 consumption rates [9]. During development at 28°C, O2 consumption rates decreased and then increased, producing a U-shaped pattern; a similiar response of metabolic heat rate occurs during development of pupae of honeybee and Galleria mellonella [10]. Pupae of different developmental age vary in their ability to survive exposure to low temperatures (7°C), and exposure to extreme high temperature (44 to 46°C) for more than two hours affected the number of M. domestica pupae that survived and emerged as flies [11]. While Noorman and Den Otter [12] showed that production of cuticular hydrocarbons from flies newly emerged from their puparia were temperature and humidity dependent in M. domestica, no studies concerning humidity effects on metabolic rates in pupae were found in the literature. Respirometric measurements on two species of adult insects, Locusta migratoria and Manduca sexta, were used to show different tolerances to anoxic environments [13]. Calorimetric methods have also been used to determine the effects of elevated CO2 and reduced O2 atmospheres on metabolic heat rates of Platynota sultana pupae [14, 15]. Calorimetry of insect metabolism is reviewed in Lamprecht and Schmoltz [16].
Very few previous calorimetric studies on insects have measured both gas exchange and heat rates. However, as shown by recent studies [6, 17–20], simultaneous measurement of heat and CO2 rates is a much more powerful method for obtaining insight into ectotherm metabolism than measurement of heat or gas exchange rates alone. This study further explores the utility of calorespirometric methods for obtaining metabolic information about insect pupae under various environmental stresses, and thus provides a comprehensive analysis of metabolism during pupal development of M. domestica.
Methods and Material
M. domestica pupae were purchased from Carolina Biological Supply Company (Burlington, NC) and maintained in a ventilated container held in the lab at a constant temperature (25 to 26°C, as measured inside the container) with moisture provided by a damp paper tissue. Pupal metabolism was measured in four Hart Scientific (Pleasant Grove, UT), model 7707, and two Calorimetry Sciences Corp. Model 4100, differential, heat-conduction calorimeters operated in isothermal mode at various temperatures from 5 to 41ºC. Each calorimeter measures heat rates from three sample ampules simultaneously. Instrument baseline corrections were made by subtracting heat rates measured with empty ampules from heat rates measured with pupae in the ampules. The pupae were randomly selected from each of the purchased lots, weighed, and placed into the 1 mL calorimeter ampules. Pupae introduced into the calorimeters were allowed to reach thermal steady state, requiring about 30 min, then heat rate data were collected for about 15 min. After the first heat rate measurement (Rq1), a 40 μL vial of 0.4 M NaOH was placed in each ampule and the heat rate was measured again after the samples reached the second thermal steady state (RqNaOH). The NaOH vial was then removed from the ampule and the third thermal steady state measurement (Rq2) was obtained. Specific metabolic heat rates (Rq) were calculated by
![]()
where FW is the sample fresh mass. During the second measurement of the heat rate, the CO2 produced by aerobic metabolism reacted with the NaOH solution forming Na2CO3 (aq) and additional heat. The rate of the additional heat liberated in the CO2+2OH–→CO32− reaction (ΔH= –108.5 kJ mol–1 CO2) is proportional to the rate of CO2 production [21]. Specific CO2 production rates (RCO2) were calculated by
![]()
To determine the temperature dependence of the metabolic rates, experiments employed three ampules per calorimeter, and were repeated three times at each temperature. Thus, nine replicates were obtained at ~3ºC intervals over the entire temperature range. To observe heat rates in the optimum range (200 to 500 μW), small samples (n=6) were used at 41ºC and large samples (n=18) at 5ºC, with determinations at intermediate temperatures using between 16 and 8 pupae. Pupae were measured within three days of receipt and were used for only one measurement to avoid any effects of previous conditions on subsequent measurements.
To determine the effects of humidity on metabolic activity, vials of water and saturated salt solutions were placed in ampules with pupae and heat rates were measured at 30ºC. Saturated solutions of KBr, NaBr, and MgCl2 were used to maintain 82, 57 and 32% relative humidity, respectively [22]. The effects of 100% relative humidity were determined by adding a vial of distilled H2O. To measure the effects of ~0% relative humidity, anhydrous CaSO4 was added to the bottom of the ampule. A circular plastic screen fitted above the CaSO4 prevented the pupae from direct contact.
The developmental stage of the pupae is not synchronized within a population and it is not possible to nondestructively determine the precise developmental age of a pupa, i.e. from the external appearance of the pupa. Therefore, changes in metabolic activity as a function of developmental age were determined by measuring Rq and RCO2 on samples taken from a given group of pupae on 4 consecutive days prior to the day of eclosure of most of the population. The population aged one day at the temperature in the container (25 to 26°C) between each measurement. The results indicate the average daily change in metabolic activity during development. Three fresh pupae were measured in each of the 18 ampules available. Average fresh pupae weights per ampule were 60.7, 61.7, 59.6, and 64.6 mg for days 1, 2, 3, and 4, respectively. During some measurements, flies emerged from their puparia. Calorimetric measurements from ampules in which flies emerged were excluded from the data. The response of pupal metabolism to varied concentrations of CO2 and O2 was determined by using different sample sizes. Because the ampules are airtight and do not allow air exchange with the external environment, pupal metabolism generates an increasing CO2 concentration and decreasing O2 concentration within the ampules. Over a fixed period of time, large samples alter gas composition in the ampules faster and thus more than small samples. Rq of small samples of 1, 2, and 3 pupae were measured at 25°C, and large samples of 12 pupae were measured at 23 and 26°C.
Heats of combustion of flies, pupae, and puparia were determined with a Parr semi-micro oxygen bomb calorimeter calibrated with 0.2 g aliquots of benzoic acid. Samples were dried in a vacuum oven at 70–80°C for 24 h, ground with a mortar and pestle, and pressed into pellets for combustion. C and N determinations
were done on aliquots of the same samples by Prof. Bruce L. Webb of the Department of Plant and Animal Sciences, BYU.
Data Analysis
Respiratory metabolism can be divided into two types of overall reactions, oxidation reactions (catabolism and oxidative anabolism, reactions 3 and 5) and disproportionation reactions (anabolism and anaerobic
catabolism, reaction 4).
![]()
where γS is the average chemical oxidation state of carbon in the substrate that is oxidized to CO2.
![]()
where γB is the average chemical oxidation state of carbon in the anabolic products (CAP) of the reaction
(other than CO2) and N, P, K represent compounds or ions of these elements. If the anabolic products are more oxidized than the substrate, as in organisms in which lipid and/or protein is a major substrate, then the anabolic reaction must be represented as
![]()
which we shall refer to as oxidative anabolism. These three overall equations can be used to interpret calorespirometric data in terms of the relative rates of reactions, including growth or development rate, and substrate carbon conversion efficiency. The quantitative model used to calculate f3, the fraction of total CO2 produced by reaction 3,
![]()
is described in previous publications [6, 19]. Note that the only unknown in Eq. (6) is γS, the substrate carbon oxidation state.
The value of γS is nearly always ≤0 in multi-cellular organisms, i.e. the substrate is carbohydrate with γS=0 and ΔH3= –470 kJ C mol–1, protein with γS≈–1 and ΔH3= –543 kJ C mol–1, or lipid with γS≈–1.4 and ΔH3= –611 kJ C mol–1, or some combination of these three substances [25]. Therefore, ratios of Rq/RCO2455 kJ mol–1 indicate the absence of anaerobic anabolism or other anaerobic reactions, the presence of oxidative anabolism and oxidation of a catabolic substrate more reduced than carbohydrate as the source of CO2 [6].
An equation for the substrate carbon conversion efficiency (ε) can be obtained by expressing the heat rate for the weighted sum of Eqs 3 and 4, or 3 and 5 [6], as
![]()
where ΔHB is the enthalpy change per Cmol for the reaction.
![]()
In reaction 7, ΔH3=(1–γS/4) 455 kJ mol–1 CO2. ΔHB is dependent on the oxidation states of both substrate (γS) and anabolic products (γB) [26],
![]()
Equation (9) represents an endothermic reaction if γS >γB and an exothermic reaction if γS<γB. Calculation of ε requires measured values of Rq and RCO2 and values of γS and ΔHB or γB. The values of γB and ΔHB can be obtained either from measurements of the composition or heat of combustion of the organism [26].
For either anaerobic or oxidative anabolism, the anabolic rate (RAP) can be calculated from Rq and RCO2 by the relation [6],
![]()
Equation (10) gives the anabolic rate (RAPΔHB) as the rate of storage (or loss, in which case RAPΔHB would be negative) of chemical energy (i.e. enthalpy) in anabolic products, or if the value of ΔHB is known, as the rate of incorporation of carbon into anabolic products, RAP, which is also the rate of growth or development.
Results and Discussion
No significant changes in pupal metabolism resulted from short-term exposure to varied humidity, elevated concentrations of CO2, or the reduced concentrations of O2 tested. Exposure to relative humidities of 100, 82, 57, 32 and 0% did not alter specific heat rates at 30°C. Specific heat and CO2 rates of large sample sizes were indistinguishable from specific heat rates from small sample sizes. Therefore, we concluded that neither short-term exposure to concentrations of CO2 up to about 10%, O2 concentrations down to about 10%, nor humidity influence pupal metabolism in this species.
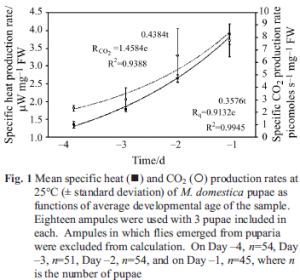
Specific heat and CO2 production rates at 25°C of samples taken from a single batch of pupae as a function of time over four consecutive days preceding eclosure are reported in Fig. 1. As is usually the case
for growing or developing organisms, both Rq and RCO2 fit increasing exponential curves in time. This response is expected because development of the fly inside the puparia is expected to progress exponentially in time after the initial disintegration of the larvae inside the puparia, thus giving rise to the U-shaped curves seen for pupal development [10]. Average weight of pupae used on each of the four days was 61.6±2.1 mg per ampule, showing there is no significant change in pupal mass during development.
The Rq produced by pupae as a function of temperature is presented in Fig. 2. At temperatures ≤23°C, little heat is generated in comparison to heat rates at temperatures above 23°C. Based on an expected exponential increase with temperature, the heat rate profile appears to be divisible into three temperature regions, the first from 5 to 18°C, the second between 21 and approximately 32°C, and the third between 35 and 41°C.
The RCO2 of the same samples are also presented in Fig. 2 as a function of temperature. The profile of the RCO2 curve vs. temperature closely resembles the heat rate vs. temperature profile. At temperatures between 5 and 23°C, CO2 is produced very slowly. A sharp increase in RCO2 occurred between 23 and 26°C, above which the rate remained fairly constant as temperature increased up to 35°C. The high RCO2 values at 38 and 41°C are probably the result of cellular response to temperature stress, such as oxidation of abnormal metabolic substrate and loss of membrane integrity.
The increased noise in the Rq and RCO2 values above 23°C is due to variation in the ages of the pupae in the samples. Smaller numbers of pupae were placed in the ampules at the higher temperatures, and thus the sample has a statistically larger chance of differing from the average age of the population. Developmentally younger pupae produce significantly lower
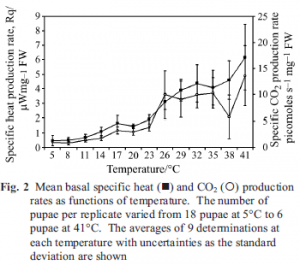
Rq and RCO2 values than older pupae. Because pupae were not sampled according to their developmental age when measuring the Rq and RCO2 values shown in Fig. 2, pupae of varied developmental age were measured and this variation produced the observed increase in standard deviation as samples became smaller with increasing temperature.
The ratio Rq/RCO2, calculated from data in Figs 1 and 2 is given as a function of developmental age in Table 1 and is plotted as a function of temperature in Fig. 3. The ratio appears to decrease with age at 25ºC, but is constant with age at 20 and 30ºC. The response of the ratio to temperature clearly differs with age. The horizontal lines in Fig. 3 are drawn at 470 and 611 kJ mol–1 CO2, the ratios for combustion of carbohydrates and lipids, respectively [25]. The measured Rq/RCO2 ratio is >470 kJ mol–1 CO2 and no changes of statistical significance occur from 5 to 23°C. At temperatures from 26 to 35°C, the ratio is slightly below 470 kJ mol–1CO2. The Rq/RCO2 values across the temperature range from 5 to 35ºC indicate that lipid and/or protein constitutes a major part the substrate [6]. The very large value at 38°C indicates a stress response and further that the catabolic substrate at this temperature must be essentially all lipid. Figure 3 shows that only at temperatures between about 26 and 35°C is it possible that a significant fraction of respiratory CO2 is produced by anaerobic anabolism.
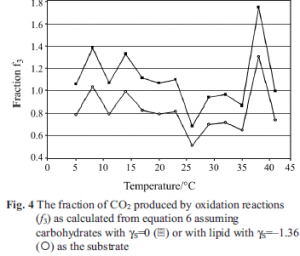
Some insight into the nature of the substrate is provided by the fraction f3 of CO2 produced by oxidation of substrate by O2, i.e. by reaction 3, see Fig. 4 and Table 1. Assuming carbohydrate (γS=0) as the substrate gives f3 values that are mostly >1, an impossibility. Assuming lipid (γS=–1.36) as the substrate gives f3 values between 0 and 1, but closer examination shows many of the values of f3 in Table 1 and Fig. 4, particularly at temperatures between 20 and 35ºC, to be unreasonable. If lipid is the substrate, all
the CO2 has to come from oxidative catabolism and f3 values should be close to unity. Further, calculation of ε values with Eq. (7) and RAP values with Eq. (10) assuming either carbohydrate or lipid substrate produces unreasonable or negative values at many of the conditions of temperature and age. Thus we conclude that the substrate cannot be either solely carbohydrate or solely lipid at all the conditions studied. To further examine the nature of the substrate, Eqs (7) and (9) can be combined and rearranged to obtain

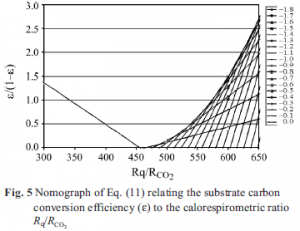
Equations (11) and (12) allow limits to be placed on γS if γB is known from heat of combustion or composition data on the emerging organism. The value of ε/(1–ε) must be ≥0 and less than approximately 9 which corresponds to ε=0.9, i.e., a 90% substrate carbon use efficiency for development. RAP must be ≥0 and must be maximum in the temperature range where rapid development is known to occur, i.e., 25 to 35ºC. Figure 5 is a nomograph limited to ε/(1–ε)=0 constructed with Eq. (11) covering the entire range of possible γS values and all the Rq/RCO2 values observed at non-stress temperatures. Note that Eq. (11) goes to infinity at γS=γB but otherwise describes a maximum curve of the saddle points for Rq/RCO2 >455 kJ mol–1. Thus, values of Rq/RCO2 less than 455 kJ mol–1 can only be achieved with carbohydrate substrate. Values of Rq/RCO2 >455 kJ mol–1 can only be achieved with substrates with γS< 0. Since Rq/ RCO2 is observed to change systematically with temperature and age, the maximum value of ε can only be achieved by varying the substrate along the curve at the maximum ε/(1–ε) shown in Fig. 5. Therefore we conclude that γS varies from about –0.6 to near 0 at temperatures between 5 and 23ºC, and at temperatures between
25 and 35ºC, γS≈0. It is clear from Figs 3 and 5 and Eq. (12) that a γS value can be chosen so as to produce positive values of RAP from 5 to 35ºC. However, RAP values from 5 to 23ºC must be small or zero and values at 25<T<35ºC would be much larger.
Table 1 gives values of RAP calculated with the values of γS given in the table. Note that RAP also goes to infinity when γS=γB. The data indicate that growth rate is at a maximum at temperatures around 25ºC in agreement with the data in Fig. 3 at 26ºC. The difference in absolute values of Rq/RCO2 between Fig. 3 and
Table 1 are caused by the difference in development age of the pupae measured. The temperature study was done with pupae in the first three days post-pupation, and the age study used pupae in the last four days of the pupal stage. At 25ºC, the Rq/RCO2 ratio goes through a minimum between days 3 and 4 of the pupal stage. In agreement with the conclusions from the temperature study, pupae kept at 18ºC did not eclose within ten days while pupae at 25 to 26ºC always eclosed in seven days or less.
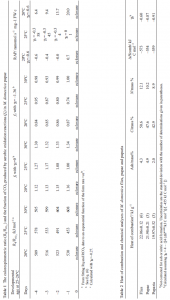
Further insight into the substrate oxidation state is provided by the heats of combustion in Table 2. These data show the puparia and pupae are both more reduced than flies, indicating that highly reduced compounds are the catabolic substrate during pupation. The increase in nitrogen content of flies compared to pupae shows the catabolic substrate is lipid, not protein. Calculated from the heat of combustion for M. domestica flies, ΔHB=+53 kJ C mol–1 if the substrate is carbohydrate, –20 kJ C mol–1 if it is protein, and –88 kJ C mol–1 if it is lipid.
The heat of combustion of M. domestica measured in this study is similar to the heats of combustion of similar organisms. The heats of combustion of Ephemerella mayflies, Agelastica alui, arthropods (except crustaceae), Otiorynchus singularis, spiders, Trypoxylon politum pupae, and in general of all detritus consumers are all in the range 20.2 to 27.6 kJ g–1.
Conclusions
This study shows that effects of temperature, humidity, CO2 concentration, O2 concentration and age on development rate of pupae can be determined using calorespirometry. Although no effects of humidity, CO2 and O2 appeared in this species, it is clear that the methods used could detect such effects if present. Respiration rate is often suppressed by CO2 as seen in studies of other species [14, 15, 17], but not in M. domestica under the conditions used here. Our results agree with previous determinations of temperature limits on development [9, 11]. Assuming the average oxidation state of carbon in M. domestica is the same as in other insects, we conclude the substrate at T≤23ºC in the pupae is a mix of carbohydrate, protein, and lipid, which has an average carbon oxidation state of≈–0.3. At 25<T<35ºC, the substrate is apparently carbohydrate. The major substrate component(s) also appears to change from protein/lipid to carbohydrate during the pupal stage. This laboratory grown population of M. domestica appears to be narrowly adapted [27] to development at temperatures near 25 to 26ºC. This work demonstrates that calorespirometry can provide significant insight into the relation between metabolism and the ecophysiology of insect pupae.
Acknowledgements
J. J. J. and D. R. C. thank the BYU Office of Research and Creative Activities for partial funding of this project. Thanks to BYU for providing faculty time and facilities.
References
- P. Crnokrak and D. A. Roff, J. Evol. Biol., 15 (2002) 388.
- C. Bech, I. Langseth and G. W. Gabrielsen, Proc. R. Soc. Lond., 266 (1999) 2161.
- T. Garland Jr. and P. L. Else, Am. J. Physiol., 252 (1987) R439.
- T. Garland Jr. and A. F. Bennett, Am. J. Physiol., 259 (1990) R986.
- R. F. Nespolo, M. A. Lardies and F. Bozinovic, J. Exper. Biol., 206 (2003) 4309.
- L. D. Hansen, C. Macfarlane, N. McKinnon, B. N. Smith, and R. S. Criddle, Thermochim. Acta, 422 (2004) 55.
- L. D. Hansen, M. S. Hopkin, D. Rank, T. S. Anekonda, R. W. Breidenbach and R. S. Criddle, Planta, 194 (1994) 77.
- S. T. Seo, D. L. Williamson and M. S. Fujimoto, J. Econ. Entomol., 83 (1990) 896.
- R. R. Rojas and R. A. Leopold, Cryobiol., 33 (1996) 447.
- E. Schmolz and I. Lamprecht, Thermal Investigations on social insects. In The nature of biological systems as revealed by thermal methods. D. Lörinczy, ed. Kluwer Academic Publishers, Dordrecht 2004, p 251.
- P. K. Tiwari, A. Joshi and D. R. K. Mohan, Curr. Sci., 72 (1997) 501.
- N. Noorman and C. J. den Otter, J. Chem. Ecol., 28 (2002) 1819.
- G. Wegener and T. Moratzky, Thermochim. Acta, 251 (1995) 209.
- S. Zhou, R. S. Criddle, and E. J. Mitcham, J. Insec.t Physiol., 46 (2000) 1375.
- S. Zhou, R. S. Criddle, and E. J. Mitcham, J. Insect. Physiol., 47 (2001) 401.
- I. Lamprecht and E. Schmolz, In R.B. Kemp [Ed.], Handbook of thermal analysis and calorimetry, vol. 4, Elsevier, Amsterdam, Netherlands 1999, p. 405.
- C. J. Downes, A. Carpenter, L. D. Hansen and R. E. Lill, Thermochim. Acta, 397 (2003) 19.
- E. B. Acar, B. N. Smith, L. D. Hansen and G. M. Booth, Environ. Entomol., 30 (2001) 811.
- E. B. Acar, D. D. Mill, B. N. Smith, L. D. Hansen and G. M. Booth, Environ. Entomol., 33 (2004) 832.
- E. B. Acar, D. D. Mill, B. N. Smith, L. D. Hansen and G. M. Booth, Environ. Entomol., (2005) in press.
- R. S. Criddle, and L.D. Hansen, In R.B. Kemp [Ed.], Handbook of thermal analysis and calorimetry, vol. 4, Elsevier, Amsterdam, Netherlands 1999, p. 711.
- L. B. Rockland, Analyt. Chem., 32 (1960) 1375.
- W. M. Thornton, Philos. Mag., 33 (1917) 196.
- E. H. Battley, In R.B. Kemp [Ed.], Handbook of thermal analysis and calorimetry, vol. 4, Elsevier, Amsterdam, Netherlands 1999, p. 219.
- I. Lamprecht, In R. B. Kemp [Ed.], Handbook of thermal analysis and calorimetry, vol. 4, Elsevier, Amsterdam, Netherlands 1999, p. 175.
- D. Ellingson, A. Olson, S. Matheson, R. S. Criddle, B. N. Smith and L. D. Hansen, Thermochim. Acta, 400 (2003) 70.
- V. Jarosik, L. Kratochvil, A. Honek, and A. F. G. Dixon, Proc. R. Soc. Lond. B. (Suppl.), 271 (2004) S219.

