Karen K. Thomas and Dr. Mark J. Rowe, Food Science and Nutrition
INTRODUCTION
Mitochondria are involved in the conversion of energy in the cell. Metabolic energy from the food we eat is converted in mitochondria to ATP by the electron transport system (ETS) and oxidative phosphorylation. The enzyme complexes involved in the ETS contain thirteen subunits which are encoded by mitochondrial DNA (mtDNA). Non-silent polymorphisms (sites in the DNA where the nucleotide differs between individuals) in mtDNA will affect these enzymes and may thereby alter metabolic efficiency and therefore metabolic rate. A lower metabolic rate is a risk factor for weight gain and a higher body mass index (BMI, a measure of obesity) (1).
This study extends a study that began with Native American populations. Samples were typed for mtDNA haplotypes (sets of linked polymorphisms as indicated in genetic literature) and it was found that mtDNA haplotypes in Native Americans correlate with RMR (2). The study was then extended to populations in China and Peru where the same Native American mtDNA types are found (3). With these subjects it was demonstrated that the same mtDNA types that increased or decreased RMR, inversely and significantly affect BMI. The purpose of this study was to determine the frequency of three mtDNA polymorphisms found in the NADH dehydrogenase complex, an enzyme complex in the ETS. Once the frequency was determined we found the association of the different polymorphic types with efficiency of energy expenditure.
SUBJECTS AND METHODS
Mitochondrial DNA and anthropometric data from over 200 Peruvian Native Americans were analyzed and compared. DNA was released from a hair root from each individual using a modified chelex extraction method. Primers were designed to amplify the segments containing haplotype specific polymorphisms. Amplification of the mtDNA by polymerase chain reaction (PCR) was followed by restriction enzyme digestion specific for haplotype specific polymorphisms. Agarose gel electrophoresis in 2.0% agarose with Tris-Borate EDTA buffer was used to confirm amplification and identify nuclease cuts, or lack thereof.
Samples identified as haplotype B or C were further tested to determine which non-silent polymorphic types each contained. Primers were designed to amplify the segments containing the ND1 3547, ND4 11,177, and ND6 14,318 polymorphic sites. Amplification of a site was done using PCR technique. Restriction enzyme digestion (cutting the DNA) specific for each polymorphic type distinguished the mtDNA samples which contained a base substitution at each polymorphic site. Agarose gel electrophoresis identified which samples were cut and which were not. These steps were completed for each sample for each of the three polymorphisms studied.
Once the samples were identified according to their polymorphisms, body mass index data was analyzed to determine whether a polymorphism correlated with BMI. If a statistical correlation between a person’s gene at a specific polymorphic site and his or her BMI is better than it is using just the general haplotype categories, then we have strong evidence that the site is significant in determining one=s genetic tendency towards obesity. Statistical analysis was by ANOVA.
RESULTS
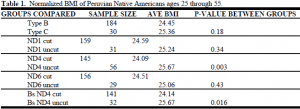
A database containing each of the sample numbers and their anthropometric data was used to record laboratory test results (cut or uncut after restriction endonuclease digestion). Analysis of the results involved finding the statistical significance of the difference in BMI between both the haplotype groups B and C and the two genetic types for each polymorphism as determined by laboratory testing. The population, adult males and females between the ages of 25 and 55, was chosen to decrease variation caused by the developmental changes in childhood. A normalized BMI was used to account for normal BMI variation between males and females, which allowed us to group the sexes together in the statistical analysis. Results are indicated in Table 1.
The difference in BMI between those with B and those with C haplotypes was not significant (p=0.18). The difference in BMI between the two polymorphic types (cut or uncut in lab testing) for the ND1 3547 and ND6 14,318 polymorphisms was even less significant than the comparison between haplotypes B and C. However, there is a significant difference in the average BMI for the groups cut and uncut for the ND4 11,177 site (p= 0.003). The genetic variation between groups can be diminished by comparing cut and uncut for the ND4 gene just between haplotype B samples. When this is done, the difference in BMI is still very significant (p= 0.016).
DISCUSSION
Of the three genetic differences between the type B and C haplotypes studied, the ND4 11, 177 polymorphism has the greatest statistical correlation with BMI. The ND4 11, 177 polymorphism may affect BMI by changing the efficiency of energy expenditure and, consequently, metabolic rate. It also appears that the ND1 3547 and ND6 14,318 polymorphisms do not have an effect on efficiency of energy expenditure. Overall, one can safely conclude that our genetics appear to have a role in determining our body weight.
REFERENCES
- Ravussin, E., Lillioja, S. (1988) Reduced rate of energy expenditure as a risk factor for body weight gain. N. Engl. J. Med 318:8.
- Rowe, M. J., Ravussin, E., Olsen, R., et al. (1994) Mitochondrial DNA type affects RMR. The FASEB Journal 8 (4): A160.
- Torroni, A., Schurr, T. G., Cabell, M. V., et al. (1993) Asian affinities and continental radiation of the four founding Native American mtDNAs. Am J. Hum. Genet. 53:563-590.

