Bradley D. Heitmann and Dr. Steven Thorley, Business Management
Volatility and Option Trading
An in-depth understanding of financial-markets volatility and how it relates to option prices is of prime importance for any options professional. Volatility is a key variable of the various option-pricing models, the Black-Scholes model being the most widely applied, that have evolved over the past twenty years. Volatility can be thought of as the standard deviation of return for the prices of the asset underlying an options contract. Generally speaking, volatility is positively correlated with options prices. This is fairly intuitive, for a long position in an option is a position with limited downside risk and unlimited upside potential. If volatility is high, a trader is more likely to receive a very high return than if the volatility is low. In both cases, the trader’s downside risk is limited to the price initially paid (the premium) to purchase the option. Because the potential payoffs are greater, the premium paid for an option on an underlying that is highly volatile will be greater than the premium paid for an option on an underlying that has a lower volatility.
Much dispute has occurred regarding the causes of volatility in financial markets. For years, analysts thought that market volatility was merely the result of the “random arrival of new information about the future returns” of an asset (see John Hull’s Options, Futures, and Other Derivatives, 3rd ed., pp. 247-249). A study by Fama and K. French, however, brought significant evidence to the academic table that new market information was not the only cause of volatility. The results of their studies “suggest that volatility is far larger when (exchanges are) open than when (they) are closed.” It logically follows that trading itself is an additional source of market volatility.
Other disputes have arisen over identifying the proper way to measure volatility. Two major types of volatility measures are currently used by the financial world to provide information on market volatility. The first is Historical Volatility. Historical Volatility is an empirical measure of the standard deviation of price movements for an asset over a specified period of time. Professionals will often look at historical volatilities over several periods of time to spot trends in volatility. The consensus is that, when pricing an option that will mature in 180 days, a 180 day historical volatility measurement should be used, a 50 historical volatility for an option that will mature in 50 days, and so on. The second type of volatility that is used by experts is Implied Volatility. To calculate the premium of an option, a trader must input the following variables into the Black-Scholes equation: the strike price, the current price of the underlying asset, the risk-free level of interest rates, the volatility of the underlying, and the time remaining until maturity. If a trader knows the current price (premium) of options in the markets, and also knows the correct values for the other variables (less the level of volatility), he/she can calculate the level of volatility implied by this information. That is, a trader can back out the implied volatility from prices found in the markets. This is the consensus level of volatility that has been reached by market participants (see Sheldon Natenberg’s Option Volatility and Pricing, pp. 290-299)
Extreme Market Volatility
Questions have arisen over what happens to option trading practices when market volatility gets very high. These questions are relevant because of the vast risk-taking opportunities that present themselves during the frequent upheavals the markets have undergone in recent history. If a trader knows how market prices will react to periods of extreme volatility, the trader is better able to make good risk decisions.
The first thing that naturally occurs in options markets when volatility reaches paramount levels is the rise of option prices. As discussed above, volatility is positively correlated with option prices and a rampant increase in volatility will cause option prices (premiums) to rise. This intuitively makes sense as well. In an interview with Mike Kraft, an Associate at Seafirst Bank in Seattle, it was mentioned that higher volatility makes investors focus a bit more on hedging. “Fear is our (referring to derivatives market makers) friend”, said Mike, because people want derivatives more than ever during periods of high volatility to hedge the downside risk inherent in their portfolios. This increase in demand for derivatives caused by increased market volatility drives up their prices.
Secondly, as market volatility gets increasingly higher, market makers get nervous about taking on positions. Market makers start to widen their bid-ask spreads. Spreads between yields on “safe” investments and similar investments that are viewed as riskier also widen. This widening of spreads causes illiquidity in the markets and trading volumes decrease. Options traders should be aware of the possibility that bid-ask spreads on options will widen during periods of market travail. The put-call parity relationship will also be under a significant amount of stress, so traders should be on the lookout for arbitrage opportunities.
One final finding of this study was the effect extreme market volatility has on the term structure of volatility. One would assume that the volatility figures used to for all options of similar maturity on a particular underlying asset would be the same. In practice, however, this is not so because of the nature of the assumptions that underlie the Black-Scholes model. The Black-Scholes model assumes that volatility of the underlying will be constant throughout the life of the option. This is obviously a hazardous assumption to be making because volatility for the prices of many assets does indeed vary significantly over time. This assumption causes the model to underprice in-the-money options and overprice out-of-the-money options. When traders take the model’s deficiencies into consideration, they assign different volatilities to options of similar maturity depending upon whether they are in-the-money, at-the-money, or out-of-the-money. A graphical representation of these volatilities is known as the “volatility skew” or “volatility smile.” Another faulty assumption used in the Black-Scholes model is the assumption that option prices are lognormally distributed. The actual distribution, while similar to the lognormal distribution, has a “fat tail”. According to Montano Nissotti, a VP in Proprietary Trading at JP Morgan in New York City, if the tail were not fat, then theoretically we would expect there to be a market crash about once every billion years. The fat tail is a reflection of traders’ expectation that market crashes occur much more frequently. In an excellent interview with Henning Hasle, a VP in Risk Management at Safeco Insurance in Seattle, Henning explained that a high degree of crash (known as gamma by options professionals) risk causes the volatility skew to steepen and to “jump up.” This shift happens over all maturities.
Probably the best way to describe volatility is by using a volatility matrix that compares implied volatilities for options on an asset over several maturities. A typical volatility matrix for options to purchase an asset (call options) could appear as follows:
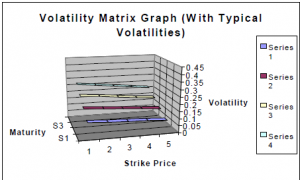
If a volatility matrix were represented graphically it might appear as follows:
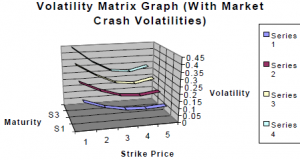
Here the volatility skew can be seen as volatility decreases as strike prices go from 1 (in-the-money) to 5 (out-of- the-money). Notice that the volatility increases as maturity increases (going from Series 1 to Series 4). This is due to the differences in the carrying costs associated with different maturities. Now let’s take a look at what might happen to this term structure of volatility during a market crash:
According to Henning Hasle, the volatility skews for the respective maturities will shift up and steepen. One question that remains unanswered (and that would be an interesting topic for quantitative research) is by how much do volatility skews jump up and steepen during times of extreme volatility and can predictive models be formulated that would allow traders to take advantage of hostile market environments? Perhaps one of next year’s ORCA Scholars will be able to shed further light on that issue.


