Kevin J Mumford and Dr. C Arden Pope III, Economics
Air pollution policy continues to be a cause of serious debate. Much of the confusion surrounding air pollution policy comes from leaders of industry and environmental groups’ appeals to ultimatums of disaster. Some leaders of industry argue that the entire American economy is at risk if more stringent air quality standards are imposed while some leaders of environmental groups argue that environmental and health disasters are unavoidable at our present level of pollution. Such arguments are not helpful to understanding the optimal level of air pollution abatement1. The correct way to approach a policy of pollution control is not by stating that air pollution is morally “right or wrong.” We should approach the question as scientists with a desire to understand the costs and the benefits of air pollution abatement.
Estimation of the optimal level of air pollution abatement requires an understanding of the costs of air pollution and the costs of air pollution abatement. Researchers have made significant advances in understanding the costs of air pollution, especially the health costs of air pollution. However, the cost function for air pollution abatement has only begun to be comprehensively addressed. This research focused on understanding the costs of air pollution abatement and estimating the marginal air pollution abatement cost curve for 1996 PM10 emissions.
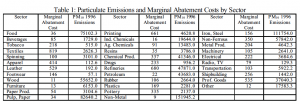
The data used in the estimation of the air pollution abatement cost curve was obtained from the EPA AIRData 20022 dataset and from Hartman et al3. The EPA emissions data (see Table 1) shows the total amount of emissions per year, in tons, by sector and pollutant for 1996. Hartman et al use data from the U.S. Pollution Abatement Cost and Expenditure4 (PACE) survey to estimate the marginal costs of air pollution abatement by industrial sector. Their regression model used to estimate the abatement cost function uses sector identification as the method of control for unobservable factors:
![]()
where Ci is the total cost of abatement for plant I in the sector being considered and Aik is the quantity of air pollutant k abated by plant i. Thus, sector, pollutant specific â’s are estimated and are used to calculate marginal costs. Table 1 also gives marginal costs by industry in 1996 dollars.
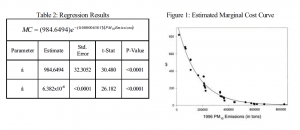
This data is used in regression analysis to estimate a social marginal abatement cost curve across U.S. industries. Each sector is ranked in order of its marginal abatement cost and weighted by its 1996 emissions. While a polynomial model would produce the marginally increasing curve desired, it is not appropriate for this analysis because it is not bounded by zero. An exponential decay regression of marginal cost on PM10 emissions is bounded by zero and gives a good estimate of the social marginal cost curve for air pollution abatement:
![]()
The parameters á and â are estimated by non-linear regression. The results of this regression are reported in Table 2 and graphically as Figure 1.
There are two weaknesses to this estimation: (1) The estimated marginal cost curve only measures direct costs and does not consider indirect costs. (2) The estimated marginal cost curve for pollution abatement depends upon tons of a pollutant emitted, while the marginal cost of air pollution (benefit of pollution abatement) depends upon concentrations of the pollutant in the air. Further research should address both of these issues.
_______________________________________
1 In this paper, I often use the term “air pollution abatement”. Some authors use this term to mean action taken to reduce air pollution while others use this term to mean reduction in air pollution emissions. These two uses are not equivalent. Here, “air pollution abatement” or simply “abatement” refers to reducing air pollution emissions.
2 See Environmental Protection Agency AIRData. 2002. U.S. Environmental Protection Agency. “http://www.epa.gov/air/data/index.html.”
3 See Hartman et al. 1997. “The Cost of Air Pollution Abatement.” Applied Economics 29: 759-74.
4 The PACE survey is completed every year by the U.S. Department of Commerce Census Bureau. It is a survey of about 20,000 manufacturing establishments with 20 or more employees.


