
Mark Pocock and Dr. James B. McDonald, Economics
A knowledge of income distribution of different professions has many policy implications. Important applications include being able to make competitive salary offers for potential employees and being able to provide appropriate financial incentives which helps to retain valued employees. In some professions salary data are readily available and in others data are limited. In academics the amount of salary data is very diverse. In one case, Oklahoma State University publishes the highest, lowest, and mean salaries by rank and discipline for different Carnegie Research Classifications. Given the estimated distribution, deciles can be estimated which facilitates an analysis of salary structure. This methodology is applied to estimate the salary distribution of statistics professors.
The Office of Planning, Budget, and Institutional Research at Oklahoma State University conducts an annual survey of faculty salaries. The 2000-2001 study reports the low, high, and average salary, and number of individuals in each category. These statistics are reported according to discipline, position, and Carnegie Research Classification. The Carnegie Classifications are Research I, Research II, and Other. Possible positions are professor, associate professor, assistant professor, new assistant professor, and instructor. All salaries are based on 9- 10 month compensation. Other compensation such as bonuses, fringe benefits or perks are not included in the salary data.
We now apply the methodology to the data for assistant professors, associate professors, and full professors in statistics for 2000-2001 for the Carnegie Research I classification, without California data which was not available at the time of publication. The data are:
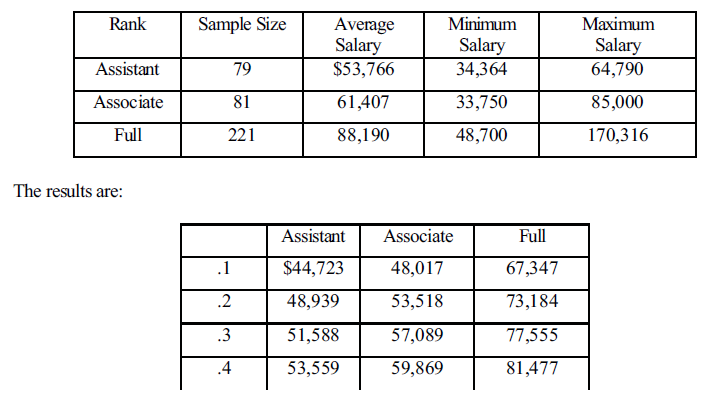
This example illustrates how information about the sample mean and minimum and maximum observations can be used to estimate an underlying hypothesized probability density function, estimate associated deciles, and other distributional characteristics. We note the increase in the value of the estimated parameter b, in going from assistant to associate to full professor, reflects increasing scale with additional experience. Concerning skewness, we note that the estimate p is less than one for assistant and associate professors with accompanying thick left tails; whereas, for full professors the estimated value of p is 1.4725 which indicates positive skewness with accompanying salary dispersion in the right tail reflecting the impact of greater dispersion of experience and professional productivity. We further observe lower values for the parameter a at higher professorial levels, again indicating the impact of increasing diversity of professional productivity. This is manifested by less peaked pdfs for full professors than for assistant and associate professors.
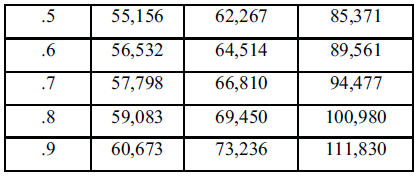
This type of detailed estimation of faculty salary distributions has many applications. Estimated distributions and corresponding deciles provide managers and administrators with important information about the shape of salary distributions. With this information they are better able to assess how much a faculty member should be paid, based on the faculty member’s ability in the field. For example, for an associate professor between the .5 and .7 decile in his field, the salary range for a nine month contract is $62,267 – 66,810. To hire a full professor in the 6 to .8 productivity decile level, one could expect to pay anywhere between $89,561 – 100,980.
Another advantage to the results presented in this paper is the ability to explore shifts in salary distributions. An analysis of estimated pdfs over time might reveal trends in salary distributions and the impact of compression of salaries between new assistants and full professors. Alternatively, the demographic impact of an aging work force on salary distributions could be analyzed.
Finally this methodology may be applied to other data sets in other disciplines using distributions which are known to provide accurate representations to related data. Parameter estimates could be obtained, deciles calculated, and other distributional characteristics analyzed for different distributions.