Nathan P. Sharp and Dr. Mark E. Clement, Computer Science
Measuring Wireless Signal Strength
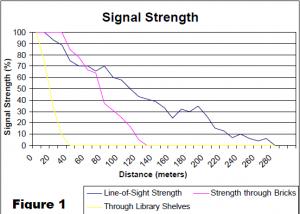
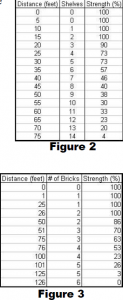
The process of measuring wireless signal strength for networks can be complex and subjective. There is no “tried and true” way of determining the best layout for a network, but with some fairly simple analysis, much can be done to improve the performance of the network. Empirical data shows how much different materials inhibit the signal (see Fig. 1-3 below). For example, in an office setting, determining if brick walls or cubical walls are more penetrable will be very useful when laying out a wireless network.
Verifying Network Simulator
The process of installing Network Simulator1 can be complex, especially in a Windows environment (it is mainly designed for Linux). By first installing Cygwin2, a Linux emulator for Windows, the program functioned correctly on an IBM Thinkpad 560Z notebook computer. Network Simulator (ns) is a very powerful program. However, the learning curve to use the program is quite steep. On a research project with a limited scope such as this, the program doesn’t really have a chance to show its true power. It is most powerful with large-scale scenarios, simulating hundreds of computers communicating through numerous routers and protocols. The equations used in ns are averages of many readings through different materials. The scenarios used in gathering data for this project were, for the most part, simulated correctly. The data points that were not simulated correctly were obvious outliers.3 It can be assumed that with many more readings, these outliers would average out to give a smooth curve.
Line-of-sight
By examining the data gathered (see Fig. 1), it is obvious that line-of-sight between the wireless router and wireless cards is a strategic factor in maximizing the utilization of the network. Where line-of-sight is possible, the extent of the network will be much greater. However, in real world situations, line-of-sight is not very feasible, especially in the workplace. In this case, minimizing the distance and number of obstructions becomes the best tool for maximizing the network. Today’s medium and high-gain antennas are very powerful and quite cost effective tools that greatly improve the signal strength.
Boosting Wireless Signal Strength
The standard antennas included with wireless routers essentially project the signal in all directions with the same strength. The signal volume, therefore, is essentially a sphere, if there were perfect line of sight in all directions. However, the booster antenna changes the signal volume. The special antenna “flattens” the signal, extending the radius that the router can reach horizontally. By flattening the signal, the range that the router can reach vertically (for example, between floors of an office building) is decreased. The higher the “gain” of the antenna, the better the antenna is at redirecting or flattening the signal.
The booster antenna used was a medium-gain (5 dBi) omni-directional antenna. The antenna performed as expected outdoors, significantly increasing the signal range, almost doubling some of the readings. The indoor performance of the antenna was disappointing, yielding little more range than the standard antennas. However, more expensive high-gain antennas have a wide variety of gain ranges (10-40+ dBi) that can greatly increase the range of a router.
Signal “Curving”
Many measurements were taken holding the laptop’s wireless card facing towards and away from the wireless router. In most cases, the signal was stronger with the card facing the router, and weaker when facing away. This behavior was expected. The surprise came within five feet behind buildings or other large structures. The signal would be weaker when facing the router, and stronger facing away. This was a consistent behavior, not just a single occurrence. The best explanation for this behavior is through a comparison of the building and a large object in a river. The water flows quickly around the sides of the object. This creates an eddy behind the object where the water churns around, but really doesn’t go anywhere. The wireless signal is weaker close to the building since it is unable to directly reach that location. Instead, the signal “curves” around the building, or possibly bounces off trees or other objects past the building.
Empirical Data Gathered
Many data points were taken, and there is simply not room to include all. Included here is a sample intended to give a feel for the research performed. As shown in Fig. 1, signal strength is obviously stronger with direct line-of-sight. This chart shows line-of-sight, through brick walls, and through library shelves. After about 14 shelves and 45 meters, the signal was gone.
Actual data values are shown in Fig. 2 and 3, also to give a feel for the research. These tables also show the number of brick walls or shelves that the signal passed through.


