Catherine Morris and Dr. Eric Hintz, Physics and Astronomy
This project looked for variability in quasars 3C273 and Mark 509. Between May 2003 and July 2003 several nights of data were taken on these quasars. The project was also to see if “good” data on quasars could be obtained using the BYU 16” telescope, since not much research has been done on this topic at BYU. Over the summer data were also taken on various other quasars whose brightness ranged between 12 and 14.
3C273
3C273 was observed in the V filter, with 5 minute exposure times, on 5 different nights over the summer 2003. Data taken by previous observers, between 1993 and 2003, were combined with the 5 nights from summer 2003. All instrumental (telescope and CCD) effects were removed from this combined data and raw magnitudes were obtained through a somewhat lengthy process that uses the standard IRAF reduction package.
The next step is to standardize the data so that an absolute magnitude for each frame is obtained, or in other words the magnitude of the quasar that would be calculated regardless of the telescope and location used to take the data. This was done using data of standard stars (stars that never vary in their brightness) taken in May 1993. From these standard fields an equation is calculated that yields an absolute magnitude for the standard stars. The equation is then applied to the quasar. By plotting the standardized (absolute) magnitude verses time (HJD), we could look for variability throughout a night and from night to night.
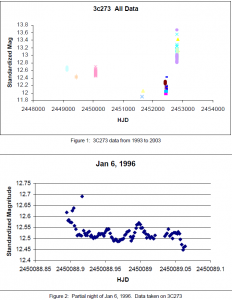
3C273 was chosen because it has been shown to vary, and in fact it may have several repeating patterns overlapping each other. We were interested to see if we could get data that matched what has already been published. Indeed, from the plots of magnitude vs HJD we were able to see both short term and long term variability. Figure 1 shows all the 3C273 data from 1993 to 2003. This plot showed that there was long term variation, and what seems to be repeating patterns within that variation. One published paper mentions a possible 2 year period.1 Our data seems like it could be showing a 2 year period, but to be sure of the repeating patterns we would need more data to fill in the gaps.
Figure 2 shows the short term variation we found over a single night. Unfortunately, this data does not represent a full night, but still we can see variation, and again, there seems to be a repeating pattern.
Mark 509 and various other Quasars
The Mark 509 data is still in the reduction process. Using data from 2001 to 2003 we also wanted to look for variation using the same process described previously. We have no results at this time.
Several other quasars with magnitudes between 12 and 14 were identified and looked at with the telescope. We found that most were probably too faint to obtain data on. Data were collected on a couple of these quasars, but have not been analyzed yet.
The results from the 3C273 data are very encouraging. It would be interesting to continuing gathering more data to extend our plot. It will also be interesting to see if the results of Mark 509 show variability.
References
- Lin, Rui-Guang, 2001, Chinese Journal of Astronomy and Astrophysics, 1, 245

