Jared Caleb Christensen and Dr. Scott D. Grimshaw, Statistics
The Shewhart control chart is the most common statistical process control (SPC) tool used to determine stability. One fundamental assumption of the Shewhart chart is that the output comes from a single, continuous stream. This implies the monitoring of a single source of variation. Filling machines at many beverage plants violate this assumption because there are central filling units with multiple heads filling individual bottles. The variability of the central filling units is the “natural, continuous variability” of the process in terms of a Shewhart chart. The heads add another source of variability. A different methodology needs to be implemented to effectively monitor both the process variability and the variability from each head. Different methods have been proposed to monitor both of these types of variability. This study examines the performance of multiple Shewhart charts, group control charts (with original and revised control limits), and a Hotelling’s T2 control chart using data from the BYU Creamery.
There must be some criteria in place to make judgments on the most correct control charting technique for multiple stream processes. This study uses two criteria to make judgments about the appropriateness of a control charting technique. The first criterion for all statistical techniques is the appropriateness of the assumptions and conclusions. If the assumptions cannot be met or the conclusions are incorrect, it is a poor judge of process control for multiple stream processes. Statistical correctness is the first criterion for any control charting method.
The second criterion for judging control chart methodologies is to factor in how they are used. Control charts were invented for manufacturing. One of the major constraints of the manufacturing environment is the need for simplicity because of the fast pace. The control chart needs to be easy to use in terms of calculations and data plotting, so it is a viable option for the manufacturing floor. The easy of use is the second criterion for the appropriateness of a control charting method. The calculations, data plotting, and control judgments need to be made quickly and, if possible, by hand.
The first tested technique was multiple Shewhart charts. Two control charts were created for each of the eight heads on the BYU Creamery’s filling machine (1). The deviation from nominal was monitored. This technique did not work. First, the multiple Shewhart charts did not properly take into account the variation of the filling unit. Any change in the amount of milk in a bottle was attributed to the specific filling head, not the head and the filling unit. Also, sixteen different charts need to be maintained. This made the calculations and data plotting particularly difficult.
The second technique was the group control chart. Two control charts were created for the central filling unit and the eight heads (1). The maximum and minimum average deviation and maximum range were used to determine stability. This technique required similar calculations to the multiple Shewhart charts, but only two charts were needed. This made the data plotting much easier. The group chart also correctly accounted for the variation in the central filling unit and the eight heads, but the limits were calculated using an incorrect model. The standard values for a single controlled parameter were used to calculate the control limits for a group control chart. These standard values 59 are based on a single Normal distribution, while the plotted data was based on eight separate Normal distributions. A different technique is needed.
The eight Normal distributions suggest a multivariate approach. The Hotelling’s T2 control chart was used (1). The control limits were based on the eight Normal distributions, which solved the statistical problem mentioned above. Two new problems arose, though. The Hotelling’s T2 statistic requires a large number of calculations. This statistic could not be easily calculated by hand. A computer is required and many companies do not have a computer directly linked to their data collection. The second problem was identifying the cause of the out-of-control point. A single head could not be readily identified without decomposing the statistic that took a computer to compute. This technique cannot solve all the dilemmas of modern manufacturing, though it is a statistically correct technique.
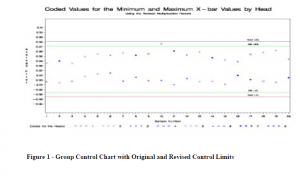
New standard values for control limit calculations were created for the group control chart (2). These values took into account the additional distributions as more heads are added to a central filling unit. This answer combined the best of both worlds. It is statistically equivalent to the Hotelling’s T2 chart, but is as easy to use as the group control chart. Figure 1 shows the original and revised control limits for the averages. The maximum and minimum averages are plotted and the head number is noted for both the maximum and minimum. Judgments of stability are made using the control limits and by a run of five observations of the same head as the maximum or minimum. This is the best technique to use for SPC on multiple stream processes.
References
- Montgomery, Douglas C. 1996. pp. 181-211, 358-374. Introduction to Statistical Quality Control. John Wiley & Sons, Inc., New York.
- Grimshaw S.D., Bryce G.R., and Meade, D.J. (1997). “Control Limits for Group Charts.” Submitted to Journal of Quality Technology.

