David A Thayer and Dr. Travis Oliphant, Electrical and Computer Engineering
Functional Magnetic Resonance Imaging is a new imaging technique that results in images showing what areas of the brain are active during different activities. In spite of the popularity of this new technology there are no commonly available or widely accepted programs for processing fMRI data. The purpose of this research was to develop an fMRI analysis program, design a simple fMRI experiment, select MRI imaging parameters for fMRI, show that the program provides useful results, and then explore the results of another fMRI research experiment. This project’s focus turned more towards image processing than actual brain function mapping, as originally designed.
The programming language selected for the fMRI processing program was Python2.2. There are several reasons for this: it provides several scientific functions that are necessary for fMRI processing that aren’t readily available in other languages, it is relatively easy to use, and is reasonably fast. MATLAB was initially used, but proved to be too slow for processing MRI data. Creating this program took far more time than anticipated.
First, MRI data must be acquired in a format that can be analyzed for obtaining fMRI data. A fast gradient echo pulse sequence was used because it tends to image oxygenated blood well. A sequence of 504 images was taken of 14 slices through the brain—36 images of each slice. Images were taken before, during, and after the subject performed an activity. Images taken during the activity are then compared to those taken while no activity was being performed.
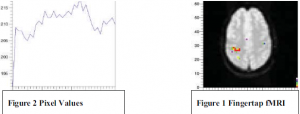
Processing the data begins by converting it from a medical imaging format to a bitmap format so that they could be read into the program. Then, the images are sorted into those taken while no activity was being performed from those taken while the subject was performing an activity. The first few images of each slice were thrown out, as were the last few and a few on the transitions between images taken during no activity and during an activity. A statistical p-test is then performed for each pixel in each slice. This returns a value that gives the probability that the difference in two samples is due only to randomness. P value thresholds, the points at which pixels are determined to show significant activity, must be adjusted for each image. For most experiments, the most significant change in activity (red pixels) was associated with a p value threshold of .0005, which is a 5 in 10,000 chance that the deviation between samples was due strictly to chance. For each activity that is chosen, the experiment was repeated three times. Then, p values are compared between experiments. If all three experiments do not agree, then the results for that pixel are thrown out. Also, if a pixel shows activity, but no contiguous pixel shows activity, the results for that pixel are eliminated. This is done on the basis that any actual activity would probably be in a region larger than a single pixel. Figure 1 shows the pixel value over time of a pixel that showed a significant increase in activity during the finger tapping experiment (images 10-25 show when finger tapping was done).

A finger-tapping experiment was performed to verify proper selection of imaging parameters and program performance. The results of this experiment were compared with other finger-tapping experiments performed by other groups. Activity was shown in the same regions in both experiments. This shows that the imaging parameters selected, as well as the program written, work. Results from this finger-tapping experiment are shown in figure 2.
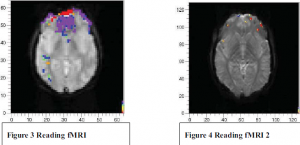
A self-designed set of experiments was then performed to determine what areas of the brain are active during reading of three different types of reading material. The first a children’s novel, the second a religious work, and the third an engineering text. These were selected because they represent three widely varying genres of literature. Such a wide difference in literature type should show a difference in activity if any difference is to be seen at all. The results proved to be somewhat difficult to analyze for several reasons. The main reason is that performing a large number of experiments was not feasible due to cost. Because a finger-tapping experiment had to be performed to verify proper selection of imaging parameters and program operation, the desired goal of scanning 8-10 people could not be achieved. Some results are shown in figures 3-4. Figures 3 and 4 show significant activity in the frontal lobe (red, yellow, and orange pixels). This is the area of the brain most active while the subject read the engineering text. This area of the brain has been linked to analytical thought and was expected to show activity. The purple, blue, and green areas of the image show areas that experienced a decrease in activity. This was unexpected, but can be explained by viewing the time when no activity is being performed simply as the time when a different activity is being performed. While activity was limited before reading began, there is no way to eliminate activities such as looking around a room or daydreaming. These areas of decrease could really be viewed as the experiment in reverse, or the areas of the brain more active while laying and watching a room while being scanned.

