Brent Allen Kenney and Dr. Michael D. Rice, Electrical and Computer Engineering
The BYU Telemetry Lab has functioned in a consulting role for NASA’s Enhanced Flight Termination System (EFTS) group since 2000. NASA initiated the EFTS program to develop a new system to be used on their many test ranges for unmanned flight vehicles throughout the country. In the event that a flight vehicle loses control and threatens to endanger lives, the EFTS will place the vehicle in a zero-thrust state either by parachute or planned explosion. To ensure safety, the desired feature of EFTS is the reliability or the communication link rather than high data throughput.
The Telemetry lab was tasked to model and simulate two modulation systems under consideration by the EFTS group, taking into count the known sources of interference that the systems would be subject to. Burst interference produced by military communication systems, such as the Enhanced Position Location Reporting System (EPLRS), was of greatest concern. EPLRS operated in the same frequency band as EFTS and frequently enough to potentially corrupt each frame of transmitted data.
The Enhanced High-Alphabet (EHA) system was proposed because of its similarity to the existing system and its relatively long symbol length, which provides greater immunity to burst interferers. An EHA symbol consists of a combination of three tones chosen from an orthogonal set of 11, which are summed and then frequency modulated. A consecutive group of ten symbols forms a frame, which contains the commands to continue, arm, or terminate the flight.
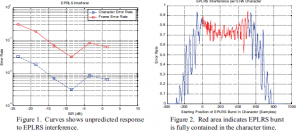
Preliminary results obtained in December 2002 showed performance irregularities. Typically, as the signal to interference ration (SIR) increases, the intended signal will overpower the interference with increasingly fewer errors. Figure 1 shows December 2002 results obtained by simulating one EPLRS burst per EHA frame. The curve is much too jagged for this type of simulation. At extremely low SIR, the error rate was much lower than expected. With 165 possible tone combinations possible and the interfering signal being so much more powerful than the EHA signal, something closer to the 1/165 (approx. 99.4% error) success range was expected instead of the 30% error rate observed. Also, the curve was not constantly decreasing, nor did it show any signs of converging to zero for large SIR.
Upon further investigation I found that the error rate of a character was dependent on the position of the EPLRS burst in the character. One would expect the error rate to be lower if only a portion of the burst was contained in the character compared to the case where all of the interference energy was present. Preliminary simulations confirmed this result but some irregularities were observed. Instead of observing a gradual increase in the error rate as progressively more of the interference energy was contained in the character time and a relatively constant error rate as long as the burst was fully contained, I observed jagged results similar to those mentioned above.

By averaging over more characters, I hoped to smooth out the results somewhat. Not achieving any success with this endeavor, I increased the precision of the experiment by simulating error rates at each sample position possible instead of the previous practice of simulating interference positions ten samples apart. Also, I constrained the EPLRS burst to be the same in all cases instead of creating a vector of interference and randomly choosing from ten selections. Figure 2 shows that the jaggedness previously observed was actually part of a periodic oscillation in the error rate, especially when only part of the burst interference was contained in the character.
Transform analysis sheds some light on the findings in Figure 2. A simple generalization is that time delays in the time domain transform to phase delays in the frequency domain. As an example let us take a periodic signal like sin(t), which has a zero crossing at t=0 as well as every multiple of Pi. Now, assume that you shift that signal by one-fourth its period to the right. Mathematically it would look like sin(t-Pi/2) but visually it still looks the same except each of the sine wave’s zero-crossings are exactly Pi/2 from where they were. Clearly the frequency of the sine wave is still the same, but it now has a different phase. Relating this simple example to the EHA signal, we note that EHA is frequency modulated, meaning that all of the information of the signal is found in its phase. In fact, the derivative of the phase is the actual signal before it was modulated. So, by shifting the interference signal and thereby changing its phase, we changed the phase of the signal that was demodulated.
These new findings explain the unexpected results seen in Figure 1 and provide direction to remedy the simulation. First, the new simulation should use a larger set of interference vectors. Second, the vectors should be chosen at random and simulated in every sample position of the EHA character to average out the effects of the periodicity shown in Figure 2. These two changes will better mimic the interference that the EFTS link will undergo and show how well the system will respond to EPLRS interference.
