T. Lance Toler and Dr. Steven R. Thorley, Finance and Managerial Economics
The idea of capitalism is based on the theory of an efficient market, or of an “invisible hand” that works tirelessly to distribute resources in the most efficient way. The stock market version of this idea is called the Efficient Market Hypothesis. This idea claims that all available information is absorbed immediately into the prices of stocks. Stock market anomalies, or any predictable patterns for high or low stock prices, therefore, should not exist. If any anomalies appear to be persistent, this suggests the market is not completely efficient.
One well-known anomaly is the January Effect. This effect is the tendency for small-cap stocks to have unusually high returns in the month of January. To test the existence of the January Effect is, indirectly, a test of the strength of the Efficient Market Hypothesis. Using a data set of monthly returns from 1926-2002 from I tested three individual hypotheses:
-The average monthly return for January was higher than other months in small-cap stocks -The average monthly return for January was not higher than other months in large-cap stocks -The January Effect was not significant in small- cap stocks within the last ten years A model was designed to isolate the monthly returns for each month and to determine if those returns were significantly different from the return for the month of January. The model is:
Ret=a+ß(feb)+?(mar)+d(apr)+e(may)+?(jun)+?(jul)+?(aug)+?(sep)+?(oct)+?(nov)+μ(dec)+u
The model uses monthly return as the independent variable and, using ordinary least squares estimation, regresses this monthly return on dummy variables, representing the months of the year. Each dummy variable is one if the return for the stocks is for the given month, and zero otherwise. A variable for January is excluded from the model, so a, the constant, represents average monthly returns for January. The other coefficients represent the difference in average returns for the respective months, compared to January. If the coefficients are statistically different from zero, we can conclude that the returns for those months are different than the returns for January.
The data used for the regressions were obtained from Ibbotson Associates and included the monthly returns for the S & P 500 index (a stock index representing large-cap stocks), and the monthly returns for the quintile of smallest US stocks (representing small-cap stocks) for the years 1926-2002. Dummy variables for the months were then assigned to each observation.
The results of the regressions produced interesting results. The regression to test the first hypothesis, using data for small-caps from 1926-2002 produced statistically significant coefficients for the variables (feb) through (dec). These variables were all significantly different from zero, even at the .5% significance level. These results for small-caps from 1926-2002 were conclusive; a January Effect existed during that time period. In fact, the jump in January prices was so large that it accounted for 40-50% of total yearly returns for the same set of stocks. Many explanations for this anomaly have been suggested. One possible explanation is tax- loss selling at the end of the year. Poor performers are dumped before the end of the year and then the same stocks are picked up again as a new year begins, inflating their price. A popular second explanation is “window dressing” by mutual fund managers. Money managers drop losing stocks so they are not printed in the prospectus. These same firms that dropped the losing stocks may very likely pick them up again after their prospectuses are mailed and a new year begins. This buying action boosts the troubled stocks’ prices.
The regression to test the existence of the January effect in large-cap stocks, using the S&P 500 index from 1926-2002, failed to produce many significant coefficients. The coefficient for September was significant at the 5% level, but was probably only significant due to randomness characteristic of the data set. The January Effect, therefore, was not seen in large-caps. In fact, the returns for large-cap stocks seemed to be generally random or at least non-significant. In other words, it is very possible that monthly returns for large cap stocks are all the same on average.
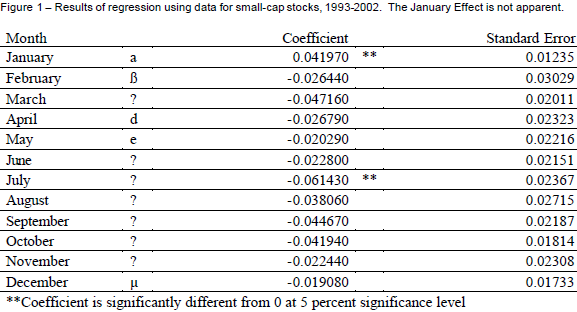
Finally, when small-cap returns for the past ten years (1993-2002) were regressed on dummy variables, again only two coefficients, January and July, were significant at the 5% significance level (Fig. 1). The July coefficient was probably only significant due to the randomness inherent in such a data set. In other words, no “July effect” exists. The results from small stocks in the last ten years show that the jump in prices seen over the last 75 years has effectively disappeared. The efficiency of the markets has likely kicked in and the January Effect has gone the way of other stock market anomalies. The opportunity for significant profit has simply dried up. Once transaction costs and commissions are factored in, anyone foolish enough to try a January play would probably experience a large negative return.