David A. Thayer and Dr. Travis E. Oliphant, Electrical and Computer Engineering
Radiofrequency (RF) transmitters and receivers are a critical component in Magnetic Resonance Imaging (MRI). These are the components used for imaging. The goal of this project was to design an RF transmitter and receiver. Both were successfully designed and implemented.
RF Receiver Design
The receiver was the more difficult of the two to design. It includes an RF receive coil, matching network, amplifiers, filters, mixer, oscillator, and analog to digital converter (ADC). The receive coil was designed using analytic equations for the magnetic field produced by a current loop. The designed receive coil actually consists of 2 groups of current loops. The main criterion of this coil is that it is homogeneously sensitive over the imaging area. The optimal spacing for two sets of coil loops has been solved for analytically and is 1.4 times the radius of the coils.
The matching network consists of an inductor and a capacitor between the receive coil and receiver circuitry. This is a simple matching problem and equations can be readily found for calculating capacitance and inductance values.
The amplifiers chosen for this application are Minicircuits ZFL-500LN connectorized amplifiers. These are low-noise amplifiers that each provide about 24 dB of gain. This part of the design was actually somewhat difficult. The signal received at the RF receive coil was estimated to be about 1-10 uV and needed to be amplified to an appropriate voltage level for analog-to-digital conversion. Originally a cheap ADC was chosen and signal conditioning was performed on a self-designed board. This proved to be very difficult to implement so a data acquisition board was purchased that does its own signal conditioning. This board requires only a 100 mV input signal. The low-noise amplifiers (LNAs) used have a 1-dB compression point at around 5 dBm which means that any signal level above that at the amplifier input will cause the amplifier to attenuate instead of amplify. This limited the output voltage of the LNAs to about 250 mV. Fortunately, using the data acquisition board (DAQ), the signal can be converted to a digital signal at this voltage.
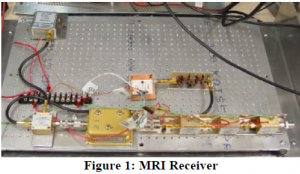
Four minicircuits amplifiers were used in the receiver along with a bandpass filter that has a 2 MHz passband centered at 41 MHz, a lowpass filter with corner frequency at 2 MHz, a 40 MHz oscillator, and a mixer. The bandpass and lowpass filters eliminate noise that is outside the frequency of interest. The mixer shifts the signal from being centered at 41.9 MHz to 1.9 MHz. A digitally controlled attenuator was also added to allow for variable strength input signals due to different RF coils. The actual circuit is shown in figure 1.
RF Transmitter Design
The RF transmitter consists of a digital-to-analog converter (DAC), a mixer, conditioning amplifiers, a digital attenuator, a power amplifier, and a transmitter coil. The DAC is part of the DAQ purchased for the receiver. It is a 12-bit, 10 MSPS converter with 4 channels. After analog-to-digital conversion the signal has to be amplified or attenuated before being sent to the power amplifier and mixed up to the necessary frequency. Using a digitally controlled switch the same oscillator was used for both transmit and receive. The power amplifier used for this application has a fixed gain so signal conditioning has to be performed before the amplifier. This was done using a digitally controlled attenuator.
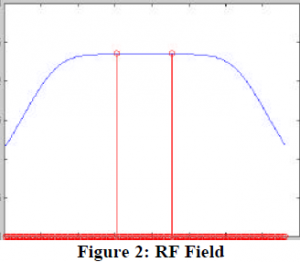
The main problem in the design of the transmitter is the transmit coil. This coil consists of 4 groups of current loops. This configuration was necessitated by the constraint that the RF and gradient coils be the same radius. Any other configuration would require an RF coil to be at the same place as a gradient coil. Unfortunately, there is no closed-form solution for the optimal spacing for a 4-coil system. The optimal spacing was found using a least-squares approach over a user-defined region. Using this technique, homogeneity on the order of .00000000001 was obtained. The field obtained using this procedure is shown below in figure 2 with the imaging area being indicated by the red circles.


