Elizabeth Adele Outdoor Hunter and Dr. Allan R Mayo, Geology
Aquifers in Utah provide water to over 84% of our population. The aquifer system beneath Utah Valley is the main provider for agricultural, municipal, industrial, and domestic use. A better understanding of the flow paths and recharge rates of this aquifer system is needed. A recent thesis from a geology student Barnhurst (2003) evaluated this Utah Valley groundwater flow system using stable and radio isotopic techniques. However, he only had limited data analysis regarding recharge waters i.e. stream flow in constructing his model. The purpose of this study was to synoptically collect and analyze these potential recharge waters. This analysis will build a database that will be used to construct more accurate models of the Utah Valley aquifer system.
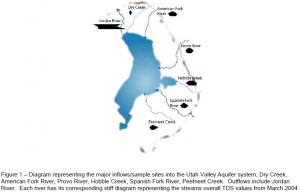
We choose 6 different streams, listed in Fig 1, that we consider as the main sources of recharge to the aquifer. We also choose to sample Jordan River because it is representative of the output waters from Utah Lake. Each stream was sampled monthly for one year beginning in Nov 2003 – Nov 2004. On site four different water samples were collected for separate analysis, along with measurements of pH and conductivity values. Around 6 gallons from each site was collected, I found this part especially enjoyable in the winter months. After collection, the waters were immediately analyzed for their bicarbonate content, a value that varies over time from evaporation. Each water sample was then analyzed for stable isotopes, including δ²H, δ 18O, δ 13C, tritium (³H), carbon-14 (¹4C), and TDS (Total Dissolved Solutes). Preparing all the samples for the analysis took a lot of consistent work and had to be done in a very timely manner. My schedule had to be planned around the water samples and sometimes when analyzing tritium that meant coming in at 3:00 pm.
Each step from field collection to lab work required very copious notes, labels, and database entries. One cold winter day I found the water freezing to the outside of my bottles, making them difficult to label. After labeling the first set, I decided to label the bottles back at the lab, where the process would go much faster. I learned an important lesson when I got to the lab and realized my memory wasn’t as good as I had thought. I ended up having to go back out and resample. This taught me the importance of keeping very careful notes and labels every step of your research no matter how simple the step might seem.
After, six months of collection and analysis we began to see important patterns in the data. One such pattern was the drop in pH over the winter months. pH is largely determined by the calcium bicarbonate of streams. Therefore, in winter months when the steams dissolve less calcium bicarbonate their pH drops. Another interesting difference among the streams were their conductivity values. Conductivity is a measure of how well the water is able to conduct an electric current. Water with higher TDS, a measure of how many cations and anions are in the water, have higher conductivities. The stiff diagrams in figure 1 illustrate a waters TDS by plotting the value of different cations and anions on interconnected line graphs. The result allows one to quickly compare the TDS of different streams according to the size of the diagram. At the end of the study I made stiff diagrams for each streams monthly data, and discovered some really varied results. For example look at how small the stiff diagram for the Alpine stream is compared to the one for Jordan River shown in figure 1. Also, compare the other streams in figure 1 to Alpine, and each other. Why would there be such huge differences in the streams TDS. Conclusions we were able to make from the TDS results include:
1. The TDS content of a river can be correlated to the type of rock its moving through and pollutants in the area
2. Alpine is sourced in an area with granites. Granite dose not dissolve as easily as limestone and so the TDS of Alpine waters is always less then the other streams
3. There is a possibility for Acid Mine drainage affecting the A.F. River evidenced by its relatively high SO42- values.
4. The High TDS Content of the Jordan River can be attributed to evaporation, pollution and springs within Utah Lake
Along with the above conclusions we were able to compile a dataset for the six different rivers that includes δ²H, δ 18O, δ 13C, tritium (³H), carbon-14 (¹4C), and TDS values for one year. This is the most comprehensive data set that has yet been compiled for inflow into the Utah Valley aquifer system. Eventually the database will be used to further interpret the system. Overall, the project and funding gave me an opportunity to put my hand into research that directly helps our society preserve this precious resource.

