Brian Latta and Dr. Matthew F. Bekker, Geography
The objective of this case study is to determine which limiting factor is most dominant in controlling tree growth at Snowbird, Utah. Trees typically respond and grow to a variety of factors. Some of these factors are precipitation, temperature, competition, soil moisture, soil depth, and disturbances. The two most dominant factors found in previous studies are temperature and precipitation. This case study found that neither of these factors is the most dominant limiting factor for tree growth.
Twenty-three tree samples were taken for this study. The samples were taken with an increment borer, at breast height on the tree. The two trees species being sampled were Douglas-fir (Pseudotsuga menziesii) and Engelmann Spruce (Picea engelmonii). All of the samples were then mounted on wood blocks, labeled, sanded (to get better clarity of each ring). Each tree sample was then cross-dated to make sure that each ring was accounted for and that there were no anomalies in the samples. Each ring from 2004 to 1970 was then measured to a 1000th of a centimeter accuracy using a Velmex Uni Slide traversing table. All of the ring width measurements were then put into an excel spreadsheet. Climate data was then obtained from Snowbird’s Mountain Operations Office. The office supplied the study with 30 years of precipitation data, in terms of water content per year. 30 years of temperature data was also acquired from Snowbird in high and low temperatures for each day. The temperature and precipitation data were also put into excel spreadsheets.
Two different statistical tests were run on a computer software program called SPSS (Statistical Package for the Social Sciences). The first test was a Mann-Whitney U test which is a simple comparison test. The two variables being compared were the tree ring growths for each year at the lower elevation site to the tree ring growths for each year at the upper site. The other test was a Spearman’s Rank Correlation Coefficient test. The Spearman’s test was used to find out if there was a correlation between all the trees growth for two different years. For example, the years 1984 and 1985 showed that all of the trees growth was strongly correlated showing a .971 correlation coefficient.
The results of the Mann-Whitney U tests showed that there was a difference in tree growth at the different elevations. The results of the Spearman’s Rank tests showed that all of the tests had a positive relationship. Some tests were really strong (.971) and some were really weak (.584).
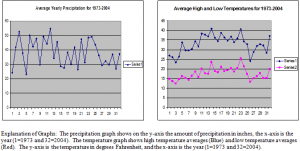
The precipitation data was then put into a graph to show wet years and dry years. To define a year wet or dry was done by taking the average precipitation for all the years and for any year above the average was a wet year and any years below the average was a dry year. The same type of graph was made for the temperature data. The averages of each year were plotted on the graph and then an overall average was calculated and every year above the average was a hot year and every year below the average was a cold year.

The seven strongest correlations and the seven weakest correlations (determined by the Spearman’s tests) were then classified into hot or cold years, and wet or dry years. For the strong relationships, if both years were hot or both years were cold and one year was wet and the other dry then for those years the dominant limiting factor was temperature because the difference did not affect the trees growth. If the opposite is true and both years are wet or both years are dry and one year is hot and one year is cold then the dominant limiting factor is precipitation because the difference in temperature did not affect the tree ring growth. For the weak relationships, if both years are hot or both are cold and one year is wet and one year is dry then precipitation is the dominant limiting factor because the difference caused a weak relationship to occur. The opposite is also true, if both years are wet or both are dry and one year is hot and the other is cold, then temperature is the dominant limiting factor because the difference in temperature caused the weak relationship.
Using the above model to test the data the results showed that precipitation affected the tree growth only 3 times, temperature affected the tree growth 5 times, and an unknown variable affected tree growth 6 times. Therefore, further research needs to be done to determine what the unknown variable or variables is that is the main limiting factor in tree ring growth. If the six unknown variables are multiple variables then temperature would be the most dominant limiting factor, but until further research is done, this can’t be proven.
