Larry Baxter, Greg Hatch
ABSTRACT
Experiments on the deposition of fume (submicron) and particles produced during black liquor combustion indicate that deposit mass accumulation increases linearly with time and is independent of temperature gradient – results that are inconsistent with the classical explanation of thermophoresis as a driving force. Temperature-controlled, cylindrical probes in cross flow collected particles for periods up to ten hours and at Reynolds and Stokes numbers comparable to those in commercial boilers. Fume deposits appear dense and smooth to the unaided eye but under microscopic examination prove to have filamentary structures, with individual filaments radiating from the probe center and consisting of strings of primary (submicron) particles with relatively thick necks. Fume particle collection efficiency averaged around 2%, much higher than is theoretically predicted based on a thermophoretic driving force.
INTRODUCTION
The deposition of carry-over particles includes sufficient theoretical and experiential background that recovery boiler design and operation can quantitatively account for its impacts [1-7]. By contrast, the factors controlling the deposition of finer particles have a substantial theoretical and experimental background [1, 8, 9],.generally in the form of thermophoresis [1, 9-21], but this background is not entirely consistent with experience in some cases. For example, many boiler operators observe that fume deposits grow essentially linearly in time [22] whereas thermophoresis predicts an asymptotically declining growth rate, with essentially no further deposition after deposits reach a few millimeters in thickness. The fume particles deposit on superheater tubes but their contribution to total deposit accumulation is dwarfed by that of inertial impaction on most of these surfaces. Higher efficient deposition of carryover particles on the first few rows of tubes can largely eliminates these particles from the flow deeper in the convection pass. Deposit growth is dominated by fume and possibly intermediate-sized particles deep in the convection pass. It is in such regions that thermophoresis makes its greatest potential contribution.
This investigation reports experimental and theoretical analyses of deposit growth and structure under laboratory conditions designed to simulate deposition deep in the convection pass. Experiments are conducted under a range of Reynolds numbers, velocities, tube and gas temperatures, particle size distributions, and times that include industrially relevant conditions. Some of the data have been previously reported [23, 24], at which time the fine particle results displayed trends inconsistent with theory. In this presentation, a conceptual model and quantitative correlation of these results is presented that correlates the data and is generally consistent with observations from field units.
Fire-side deposition of fume (submicron), and intermediate-sized (1-100 micron), particles on heat transfer surfaces in kraft recovery boilers poses a significant operational problem. These deposits plug gas passages, decrease heat conduction, and contribute to corrosion in the convection passes of commercial systems. When soot blowing becomes ineffective, a boiler must be shut down for expensive water washing procedures. An understanding of deposition mechanisms and deposit properties is essential if recovery boiler fouling is to be managed. Further, ash related problems are a major consideration in boiler design and warranty.
Fire-side deposits can be formed by particulate deposition, vapor condensation, or chemical reaction. Each of these will be discussed in turn. Particulate deposition occurs when particles, small enough to be entrained by the flowing hot gas, impinge and adhere to heat transfer surfaces inside of the boiler. There are several mechanisms by which entrained particles can reach a heat-transfer surface in a flow field. Inertial impaction occurs when an entrained particle has sufficient inertia to deviate from the gas streamlines as they change direction in the vicinity of an obstruction in the flow field. Turbulent eddy impaction is similar to inertial impaction except that it involves turbulent fluctuations in gas flows near surfaces. Such fluctuations in both gas flow and boundary layer thickness can lead to the impaction of smaller particles than would normally reach a surface in the absence of turbulence. Thermophoresis refers to small particles moving down a temperature gradient under the influence of gas molecules. The kinetic energy of gas molecules colliding with and leaving the particle is higher on it’s hot side than on it’s cold side, thereby causing a net driving force toward the cool side [25].
Vapor condensation occurs in the presence of a surface with a temperature below the dew point. A liquid layer may form on the surface, depending on the thermodynamics of the system. Chemical reactions between the gas and a surface can also lead to deposit growth. Sulfation of carbonate is an important reaction in the smelt bed of recovery boilers. But, since alkali carbonates are a major constituent of superheater deposits [26], SO2 in the flue gas can react with the carbonate in carryover deposits to form CO2 and a sulfate deposit.
In the classical view of recovery boiler fireside fouling, there are two principal particle sizes responsible for the formation of deposits. Carryover particles are burned-out liquor droplets, 100 m to a few mm in size, that become entrained in the upward flowing gases. They deposit primarily on the bull nose and in the superheater sections via inertial impaction. In recent years, recovery boilers have been built with larger cross-sectional areas in the lower furnace and superheater region in order to decrease the gas velocity and thereby decrease the number of entrained particles. Fume particles are defined as submicron particles generally formed by vapor condensation. During combustion, a fraction of the alkali chlorides in black liquor vaporizes. As the gases cool, particles nucleate and grow. Fume particles, in the classical view, deposit in the generator bank and economizer sections of the boiler via thermophoresis.
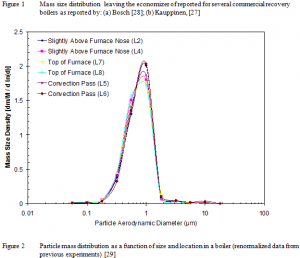
Several published measurements have been made of the particle size distribution in the convective sections of recovery boilers. Two early published works characterize the aerosol leaving the economizer section [27, 28]. The results consistently indicate that particles are approximately 1 µm in aerodynamic size (0.8-0.7 µm in physical size, see Figure 1). It is not clear whether these are the only particles present in the convective section, or if the convective pass of the boiler removes larger particles through deposit formation. More recent data [20, 29-31] indicate similar results in the boiler bank and upper furnace regions of the boiler, with little to no indication of changes in the aerosol size with increased residence time from the top of the furnace (see Figure 2 as an example). The illustrated results include only the fume particles. The same investigations detected varying quantities of intermediate-sized and larger particles.

The deposition of such particles on boiler tubes is also recorded in these and related investigations. One relatively consistent but largely anecdotal trend recorded by the field studies is that even fume deposits grow approximately linearly with time and on both the leading and trailing edges of the tubes, with trailing edge deposits only somewhat thinner than leading edge deposits. By contrast, deposits comprised primarily of larger particles (intermediate-sized particles and carryover) accumulate with strong preferential growth on the leading edge of tubes. Laboratory experiments detailing the structure of such deposits indicate that fume deposits, while appearing smooth to the eye, actually consist of fine filaments with large aspect ratios (many hundreds to thousands) and high porosity (often exceeding 90%). More recent field experiments confirm this deposit structure [32]. The linear growth rate with time is inconsistent with thermophoresis, the most widely held theory of fume deposit formation, since the latter predicts decreasing rates of deposit growth as the deposit surface temperature approaches the gas temperature. This investigation attempts to reconcile this apparent discrepancy and proposes alternative views of fume particle formation that are consistent at least with the laboratory and quantitative field data at our disposal.
EXPERIMENTAL
The details of the experimental facilities, probes, diagnostics, and fuels used in this investigation appear elsewhere [24, 33, 34]. The focus of this paper is on the analysis of results. The original experimental facilities include the Multifuel Combustor (MFC) at Sandia National Laboratories’ Combustion Research Facility (CRF) and its associated diagnostics and the black liquor fuels. Temperature-controlled probes are used to simulate the heat transfer tubes found in full-scale boilers. The probes are scaled with respect to Reynolds number, Stokes number, or both, depending on the particle deposition mechanisms under investigation. A variety of in situ and ex situ diagnostics are used to characterize deposit properties on these surfaces. Those most relevant to this investigations are briefly presented here in the order of: (1) in situ, real-time, diagnostics; (2) sampling (ex situ), real-time diagnostics; and (3) sampling, post mordem diagnostics.
The Multifuel Combustor
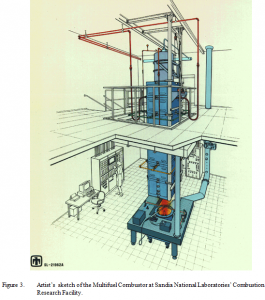
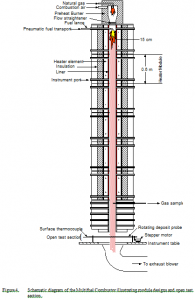
The Multifuel Combustor (MFC) at the Sandia National Laboratories’ Combustion Research Facility in Livermore, California is a down-fired, small pilot-scale, turbulent flow combustor that allows for gas and particle temperature histories to be varied over the range of conditions commonly experienced in commercial combustors (Figure 3). In general, fuel can be injected from any of 11 positions along the length of the combustor (Figure 4), providing variation of fuel residence time in he combustor. The individual modules of the combustor can be independently controlled to vary local conditions of temperature and gas composition, simulating the residence-time dependence of these local variables in commercial-scale equipment. Most of the experimentation is performed in the open test section at the bottom of the combustor, where optical access and laboratory equipment are available.
In Situ, Real-time Diagnostics
The in situ, real-time diagnostics used in this investigation monitor deposit and entrained particle properties. Monitored deposit properties include thickness, surface temperature, mass, and emissivity. Monitored entrained particle properties include concentration, size distribution, and velocity. Deposition targets used in the test section of the combustor provide a surface from which other measurements are made and independently monitors in situ properties such as heat flux, probe surface temperature, cooling gas flow rate, and cooling gas temperature. The deposition targets are discussed first, followed by discussions of the other in situ, real-time diagnostics relevant to this investigation.
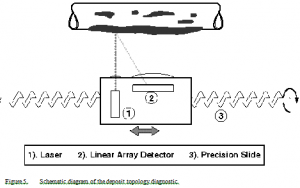
A range-finding laser mounted on a precision linear slide measures the surface topology and, by difference, deposit thickness along a single line parallel to the probe axis (Figure 5). The measurement range is 0-32 mm, and the resolution is ± 8 µm under ideal conditions, and ± 30 µm under typical black liquor combustion conditions. Successive scans along the same line at regular time intervals resolve the temporal growth rate. A series of scans at different radial positions resolves spatial variations. When the deposit growth rate is small, signal-to-noise ratios are poor. Under these conditions, as were experienced during some of the fume deposition experiments, the deposit thickness could not be reliably resolved in situ even after several hours of growth.
Optical pyrometers are used to measure deposit surface temperature. The measurement technique assumes that all radiation in the instrument line of sight derives from surface emission. Therefore, measurements are made on the shadowed side of the probe with the deposit rotated out of the direction of flow of the gases to avoid surface reflections of flame radiation or with on the windward side with radiation temporarily blocked by some other means. Combustion flows with high particulate loading, such as those commonly experienced in black liquor systems, require that the particles in the line of sight be blocked to prevent scattering of radiation into the diagnostic. Several different pyrometers are used ranges of varying from 250 -850 °C and (400) – 1200 °C, respectively, and with an ideal accuracy of ±0.25 °C and a practical accuracy of ±1 °C if reflected and scattered radiation effects are removed and the probe surface emissivity is known. Over the range of reasonable emissivities for such deposits, the temperature can be characterized within ±15 °C. Deposits grow either axisymmetrically, by rotating the probe, or traditionally, with stationary probes. Axisymmetric deposits are used to characterize thermal conductivities whereas traditional deposits are used to monitor accumulation rates, structures, and mechanisms, these last issues being the focus of this investigation. Temperature measurements from three locations on the probe allow temperatures on the remainder of the probe to be interpolated when the deposits are axisymmetric.
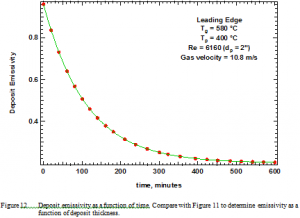
A Pyrolaser™ laser pyrometer from Pyrometer Instrument Co. quantifies surface emissivity. This instrument is nominally capable of simultaneous temperature and emissivity measurement, but the temperature range (800-1500 °C) was too high to be useful for at least the initial measurements for this investigation. Emissivity is measured at 870 nm, deemed suitably close to the wavelength at which the pyrometer measurements were made (890 nm) to be accurate for determining temperature. The probe is nominally capable of in situ measurements but its 5 cm focal length is too short to be used as an in situ device in this investigation. Therefore, the probe and deposit were periodically removed from the reactor and emissivity measurements were performed at room temperature. While total emissivity has a significant temperature dependence, emissivity at a given wavelength is not significantly temperature dependent in the absence of phase changes or other physical or chemical reactions. The occasional emissivity measurements were fit to an exponential function of deposit thickness to obtain a continuous estimate of emissivity with deposit thickness/time, as is illustrated later. Measured emissivities at this wavelength in this investigation ranged from 0.2 (opaque fume deposit) to 0.95 (oxidized and heat treated probe with no deposit). Independent measurements using an FTIR (discussed next) indicated similar ranges of emissivity in spectral regions where the deposit is not absorbing [35].
Fourier transform infrared (FTIR) emission spectroscopy characterizes spectral radiative properties and composition of the deposit [35]. Spectral emissivities are characterized between 2.5 and 25 µm (4000 to 400 cm-1) except in isolated bands where gas-phase, infrared-active species (principally H2O and CO2) interfere. Spectral emissivities can be determined within ±5 percent. Condensed-phase chemical species with absorption bands in this wavelength region appear in these spectra in quantifiable concentrations. With respect to species of interest to black liquor combustion, this includes essentially all carbonates, sulfates, silicates, some oxides, but few chlorides. These measurements principally contribute an independent measure of emissivity for the present investigation. While the FTIR emissivities are recorded over a broad wavelength range, the range does not include the region where the pyrometric measurements are recorded.
An in situ, laser-based diagnostic (PCSV system by Insitec) measures the particle concentration, size distribution, and velocity in the size range of 2-130 µm ideally, and 5-100 µm under most conditions relevant to black liquor combustion. The device is a multibeam system that approximates a point measurement with diagnostic volumes approximately ellipsoidal in shape. The ellipsoidal diagnostic volumes have major and minor axes of about 1 mm and 450 µm for one beam and 0.3 mm and 50 µm for the second beam. The accuracy of the diagnostic, when properly calibrated and aligned, is ±10% or ±1 µm, whichever is larger. Concentrations and velocities are measured with about ±5% accuracy. These accuracies are determined by spinning reticules with known particle sizes through the beam. Real systems typical of black liquor combustion contain high particle loadings. This compromises the measurement by both beam obscuration and multiple scattering in the diagnostic volume such that data reliability for small particles ( Particle mass is determined using a magnetic force restoration technique on a cantilevered probe. This dynamic balance monitors the mass of the growing deposit. The ideal resolution of the deposit mass diagnostic is 10mg. The mass of the probe, deposit, and some of the electronic control components are determined simultaneously. When the deposit mass accumulation rate is small, instrumental drift becomes a major source of error in the measurements. Under these conditions, as were experienced during some of the fume deposition experiments, the mass of the deposit could not be reliably resolved in situ even after several hours of growth. For the low-mass cases, the deposit is rinsed from the probe with water, dried, and weighed with an analytical balance.
An aerosol spectrometer samples and classifies particle sizes in the range of 0.1-7.5 µm. This diagnostic provides complementary analyses to the in situ PCSV equipment. The estimated accuracy of the instrument is ±15% and the demonstrated reproducibility in combustion environments is ±7%. This is the primary means of characterizing particle size distributions in these experiments.
A continuous gas analysis system provides continuous monitoring of CO, CO2, NOx, O2, SO2, and total hydrocarbons (THC). Non-dispersive infrared detectors (NDIR) measure CO, CO2, NOx, and SO2 concentrations. A magneto-pneumatic oxygen analyzer provides oxygen concentrations. A flame ionization detector is used for THC. The analyzers (Horiba models CFA-321, CFA-311, CMA-321, and FIA-HC) are incorporated in a gas sampling system that controls moisture, temperature, pressure and flow rate of sampled gases. The analyzer repeatability is ± 0.5% of full scale when concentrations are greater than 200 ppm and ±1% of full scale for lower concentrations. Zero drift is no more than ±1% of full scale per week for concentrations greater than 200 ppm and ± 2% of full scale per week at lower concentrations. Span drift is no greater than ± 2% of full scale per week. The exception is the THC measurement, which has a ± 1% of full scale drift per day and a repeatability of ± 1%. Minimum detectable limits are no more than 0.2% of full scale. Analyzers are typically calibrated before each experiment. In these experiments, these analyzers provided combustion characterization information (exit oxygen content, etc.).
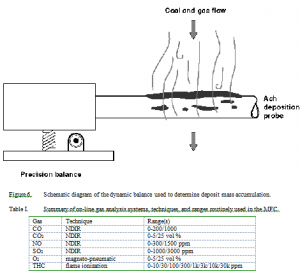
Interferences from other gases are summarized below, all of which were measured with nitrogen as the makeup gas. The interference data indicate the fractional response of an analyzer to a gas other than the one being analyzed. The strongest interference is NO with O2, where a 962 ppm concentration of NO is interpreted by the O2 sensor as 500 ppm O2. This interference arises because O2 and NOx are paramagnetic, with the strength of the NO and NO2 paramagnetic susceptibility being roughly 43 and 28 % that of oxygen. Oxygen concentrations are accurately determined so long as they exceed those of NO by approximately an order of magnitude. This behavior is typical of all paramagnetic-style oxygen analyzers and is a primary reason such analyzers cannot be used to measure low oxygen concentrations precisely in combustion flows. The remaining interference ratios are two to five orders of magnitude lower and present little concern under typical combustion conditions. Entries that indicate 0.0 indicate no interference was noted. Blank entries indicate no measurements were made.

Fuel Composition
In these experiments softwood kraft liquor was fired through an atomizing nozzle. The elemental composition of the liquor is shown in Table III. For generating predominantly intermediate sized particles (with some fume), the liquor was fired at 33.6% solids in water. For generating only fume particles, the liquor was fired at 2% solids, 28% water, and 70% methanol. Generation of fume particles is through condensation of inorganic vapors. Methanol increases the temperature in the combustion region (compared to water), which leads to increased vaporization of the inorganics. In addition, elemental sulfur was added to the liquor for some of the fume experiments. In full-scale boilers, fume particles (condensation aerosols) have been analyzed (Tran, 1986) and found to contain on the order of 90% sulfate and 10% carbonate salts. Carryover particles are commonly dominated by carbonate and tend to impact in the superheater rather than penetrate as far back as the generator bank. In the MFC, all of the inorganic matter passes through the reactor so there is no net removal of carbonate. Elemental sulfur is added to the liquor in sufficient quantity (86.3 mg S per gram dry black liquor) to produce alkali salts that have a sulfate to carbonate mass ratio of 9 to 1, similar to that found in recovery boiler convection passes.

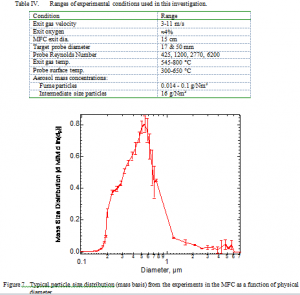
The range of experimental conditions is shown in Table IV. To achieve the entire range of values, including probe Reynolds number, we constructed a device at the exit of the reactor that narrowed the flow to a slot. It also screened out essentially all particles larger than on micron and consequently decreased the total particle mass loading relative to commercial recover boilers. Some experiments included larger particles, as indicated in the table, but this paper focuses on those that contained fume particles only.
The dependent variables of primary interest were deposit mass and volume accumulation rate and deposit morphology. These were examined as functions of the following independent variables: (1) probe Reynolds number; (2) probe Stokes number; (3) gas temperature; (4) probe surface temperature; (5) gas-probe temperature difference; and (6) particle size distribution. Variation of deposit formation conditions over the ranges indicated in Table IV shifted the dominant deposition mechanism widely, allowing some assessment of deposit formation rate and property development as a function of deposition mechanism. Separate discussions appear below for deposits generated from fume particles and those generated from intermediate particles.
RESULTS AND DISCUSSION
Particle Size Distribution
A typical particle size distribution with error bars determined at the reactor exit appears in Figure 7. By contrast with the sampled data from commercial systems, this distribution is based on physical, not aerodynamic diameter. Adjusting for fume particle density (multiplying these data by the square root of the fume particle specific gravity, approximately 2.6 g/cc), the experimentally generated size distribution compares very well with the aerodynamic distributions measured in field analyses (compare with Figure 2).
Essentially all particles are submicron, at which size inertial impaction, eddy impaction, and similar momentum-driven deposition mechanisms are insignificant in these flows. The error bars in the figure are computed from repeated measurements under the same combustion conditions and represent 95% confidence intervals based on these repeated runs. The variation in size distribution among experiments conducted under different conditions of temperature, flow rate, Reynolds number, etc. exceeds the uncertainty indicated in this figure, but in all conditions the particles in the fume experiments were submicron-sized are relatively concentrated around one size and in all cases where repeated aerosol size measurements were completed the precision of any given experiment was comparable to that shown in the figure.
Qualitative Deposition Observations
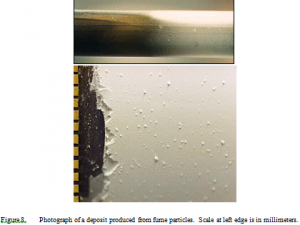
Deposits generated from fume particles grew slowly. Experiments lasting as long as 10 hours produced no more than about 4 mm of deposit. This partially arises from low fume loading compared to commercial systems, but the difference in deposition rates of fume deposits compared to those from larger particles is nevertheless substantial. Deposits exhibited a very fine texture and were highly reflective. To the eye, they appear smooth and uniform (Figure 8) with occasional surface blemishes that are more prevalent on the leading edge than on the trailing edge. These are associated with rogue large particles that do not appear to contribute significantly to the deposit mass based on both the photographic evidence and on the measured size distributions. The pattern of deposit formation seen on the probe is also consistent with traditional, thermophoresis-inspired concepts in that the windward (leading edge) deposit, where temperature gradients are greatest, extends further toward the cool end of the probe than does the leeward (trailing edge) deposit, where gradients are weaker. (The leading edge is at the top in the upper portion of Figure 8). Additionally, the impression one gets when watching these deposits form is that they initially form quickly slowing to an apparent standstill with time. This impression may derive in part from expectations based on thermophoresis physics. This, however, turns out to be an artifact of being able to see the initial deposit with high contrast against the dark background of the probe but not seeing additional deposition as white particles accumulate on the white initial layers of the deposit. As will be seen, the deposition rate does not change appreciably with time.
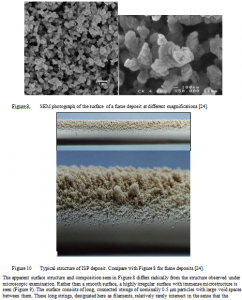
The apparent surface structure and composition seen in Figure 8 differs radically from the structure observed under microscopic examination. Rather than a smooth surface, a highly irregular surface with immense microstructure is seen (Figure 9). The surface consists of long, connected strings of nominally 0.5 μm particles with large void spaces between them. These long strings, designated here as filaments, relatively rarely intersect in the sense that the structure more resembles a group of strings intertwined with each other than a matrix of solid with voids in it. Additionally, the primary particles that comprise the filaments resemble the same particles analyzed by the aerosol spectrometer, being well approximated by the measured size distribution of the entrained particles (Figure 7). There is essentially no evidence of non-fume (>1 μm) particles in the deposit with the exception of the occasional blemishes seen on the front side of the probe (Figure 8). These deposit structures bear close resemblance to those reported from the boiler bank region in field tests in recovery boilers [32]. By contrast, deposits generated from intermediate size particles and carryover particles have markedly different structures, as seen in Figure 10, which is derived from laboratory experiments with ISP and where the structure is evident in the photograph.
Quantitative Deposition Observations
A total of 14 investigations resulting in particle deposition rate as a function of time form the basis of our analysis. Results from the longest of these appear here in detail with the remaining experiments, all of which showed the same essential trends summarized below.
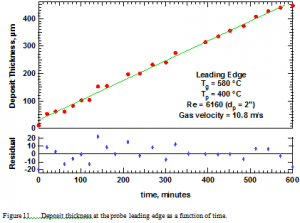
Figure 11 illustrates the observed deposit thickness as a function of time. The top portion of the figure shows data points taken every few minutes over a period of 10 hours from the leading edge of the probe. As is evident, the rate of deposition (slope of the line in the graph) does not vary with time. The residuals indicated at the bottom of the graph are the differences between the straight line drawn through the data and the measured points. These residuals lie within about 4% of the line over essentially the entire investigation.
This result differs from the theoretically expected result based on a thermophoretic driving force and from the qualitative appearance of the rate of deposition. As explained earlier, the qualitative impression of deposition rate suggested that the initial deposit grew rapidly followed by a much slower and eventually stagnated rate of growth. Aside from the bias suggested by a thermophoretic driving force, this impression was mainly based on easily being able to detect the white deposit on a dark background and not being able to detect subsequent additional white deposition against the white background. The thickness per se is too thin to detect by eye.
Optical determination of deposit surface temperature requires measuring deposit emissivity, which appears in Figure 12 as a function of time. Emissivity measurements were done only occasionally and fit with the curve indicated in the figure. Spectral emissivities were also measured and are reported elsewhere [35] as a function of both wavelength/wavenumber and deposition time. Emissivities vary widely depending with wavelength, ranging nominally from 0.2 to 0.9 in the infrared. The emissivities required here are those in the near infrared, where the optical pyrometer is used to measure temperature.
Deposit surface temperature and gas temperature appear in Figure 13 as a function of time. The residuals represent differences between the measured and predicted deposit surface temperature using a fundamental model for thermal conductivity and heat transfer and assuming a linear rate of deposit growth in time. A more detailed description of deposit thermal conductivity and its in situ analysis is available elsewhere [36, 37].
The deposit surface temperature nearly reaches its asymptotically constant value during this experiment and changes substantially from its initial value. Shorter duration experiments terminated prior to the surface temperature reaching this asymptote. All experiments included significant changes in surface temperature with time.
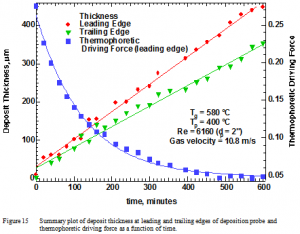
These measurements allow computation of the thermophoretic deposition driving force as appears in Figure 14. Assuming constant deposit bulk density, the deposition rate observed should be proportional to this value. That is, the slope of the line in Figure 11 should be linearly proportional to the value in Figure 14 at any given time. Since the slope does not change with time whereas the values in Figure 14 change by more than a factor of 5, there is a large discrepancy between theory and measurement if deposits accumulate by thermophoresis. Such a discrepancy causes us to reject thermophoresis as the mechanism for deposition in this (and the additional 13) experiment and seek alternative explanations.
The smoothness of the deposit surface indicates that these results are not spurious artifacts of phenomena on the leading edge of the probe. Similar data were collected for other probe locations, including the trailing edge. The trailing edge data appear with the leading edge and thermophoretic driving force results in Figure 15 as a summary plot.
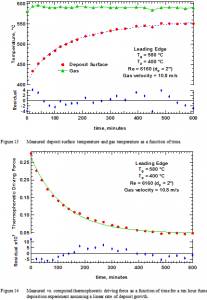
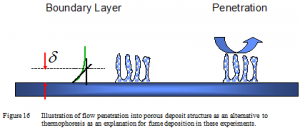
Figure 16 illustrates a conceptual alternative to thermophoresis as an explanation for fume deposition in recovery boilers. In this view, the porosity and open structure of the deposit allows at least a portion of the gas to penetrate the deposit rather than form a traditional boundary flow at the deposit surface. The spacing between filaments in the deposit is on the order of several microns (Figure 9), slightly larger than the mean free path of gases, supporting the idea that at least some bulk flow of gas is possible under these conditions. The presence of the deposit must present some resistance to flow and it would be unrealistic to expect the flow of gases to proceed through the deposit without adjustment, so a complete picture would include some fraction of the gases flowing around the outside of the deposits and some penetrating the deposit. However, some of these details are neglected in this simple picture for sake of clear illustration.
Those gases that penetrate the deposit should carry their entrained particles with them. However, the deposit structure will collect these particles with high efficiency and primarily at the end of the existing filaments because of the Brownian motion inducing significant lateral random velocity to their trajectories. The net effect is that at least some of the boundary layer is inside the deposit (as illustrated at the left in the figure), allowing particles to collect at much higher rates than would be the case for purely thermophoretic deposition. Surface renewal and boundary layer theories lead to similar predictions, in this case with the surface eddies bringing ever fresh quantities of particles to the surface.
The quantitative expression of these ideas is challenging due mainly to the complex structures of the deposits and our results to date will probably be revised in the future. The key quantity of interest to us is the deposition efficiency, defined here as the fraction of particles in the flow cross section that ultimately deposit on the probe. Deposition efficiency can be expressed as the following homogeneous function
![]()
where η represents efficiency, Re is Reynolds number based on probe diameter, ρf represents feed density and ranged from 0.85 to 1.05 g/cc in these experiments, and cm represents mass concentration of fume in the gas and ranged from 0.014 to 0.1 g/Nm3 in this investigation. This expression accounts for about 85% of the total variation in the data and all terms are statistically significant (as determined by t values). It covers a Reynolds number range from 440 to 6200 and a range of the last term from nearly 0 to 0.5. This statistically suggested expression fails to account for many physically logical trends. For example, it does not explicitly account for deposit structure or other parameters that play an important role in deposition. Additionally, deposition efficiency by this mechanism should go to zero as either Reynolds number or fuel feed density goes to zero and should scale proportional to fuel feed density. Finally, the effect of particle true density appears in both the numerator and denominator of the last term, largely canceling one another whereas the expected effect of fume particles density (which did not vary in this experiment) should be to increase deposition efficiency with increasing density. None of these expected trends is captured by this statistical correlation and an improved, more physically based correlation is under development.
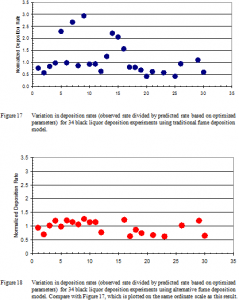
Using traditional approaches for data analysis and results from a total of 26 deposition experiments, the normalized rate of black liquor deposition on probes (measured divided by predicted) varies by ± a factor of 3 (Figure 17) whereas use of the alternative model reduces this variation to about 30% (Figure 18). These predictions include all experiments involving fume particles, not just the 14 for which a complete enough data set was available for the detailed analysis described earlier (thickness, temperature, temperature difference, thermophoretic driving force, and leeward edge thickness as functions of time). There are an additional 4 experiments not shown in either graph because of missing critical data
CONCLUSIONS
Experimental data regarding deposition of fume particles (0.01-1 µm) and intermediate (1-100 micron) black-liquor particles on tube surfaces are available under laboratory conditions that closely simulate the range of conditions in commercial recovery boilers. The objective in collecting these data was to determine the mechanisms and rates of particle deposition under conditions typical of a recovery boiler. Experimental conditions that were varied independently during these experiments include particle size distribution, particle loading, tube Reynolds number, tube Stokes number, gas temperature, tube temperature, and the difference between tube and gas temperature. The dependent variables include deposit volumetric rate of growth, mass rate of growth, deposit morphology, deposit emissivity, and deposit surface temperature.
The primary conclusions from the experimental work include: (1) the fume deposition mechanism does not appear to be controlled by thermophoresis, as we had hypothesized at the beginning of the experiments; (2) fume deposit at rates linear in time under a wide variety of conditions; and (3) microstructures of fume deposits include filaments with relatively few connections between them;
A proposed conceptual model of the deposition mechanism and mathematical expression for deposition rate with an incomplete theoretical basis are provided to predict fume particle collection efficiency over the range of Reynolds numbers and other parameters tested, which includes those at commercial operating conditions.
ACKNOWLEDGEMENTS
This work was sponsored by the US DOE Office of Industrial Technology and a consortium of industries, including Mitsubishi Heavy Industries, Kvaerner Pulping, Weyerhaeuser, Ahlstrom Machinery, Babcock and Wilcox, ABB-Combustion Engineering, International Paper, and Gottewerken. The authors are grateful for both their financial support and technical reviews of the work.
REFERENCES
- Tavares, A., H. Tran, D. Barham, P. Rouilard, and B. Adams, Fume chemistry, morphology and deposition in a kraft recovery boiler. Pulp & Paper-Canada, 1996. 97(10): p. 51-56.
- Tran, H., A critical review of the use of fireside additives for deposit control in kraft recovery boilers. Tappi Journal, 1999. 82(1): p. 212-219.
- Tran, H., M. Gonsko, and X.S. Mao, Effect of composition on the first melting temperature of fireside deposits in recovery boilers. Tappi Journal, 1999. 82(9): p. 93-100.
- Shenassa, R., H. Tran, and D.C.S. Kuhn, Dynamic study of carryover deposition in kraft recovery boilers using an entrained flow reactor. Pulp & Paper-Canada, 1999. 100(10): p. 56-62.
- Tran, H.N., X. Mao, D.C.S. Kuhn, R. Backman, and M. Hupa, The sticky temperature of recovery boiler fireside deposits. Pulp & Paper-Canada, 2002. 103(9): p. 29-33.
- Shenassa, R., D.C.S. Kuhn, and H.N. Tran, The role of liquid content in carryover deposition in kraft recovery boilers – A fundamental study. Journal of Pulp and Paper Science, 2003. 29(4): p. 132-136.
- Mao, T., D.C.S. Kuhn, and H. Tran, Laboratory study of carryover deposition in kraft recovery boilers. Journal of Pulp and Paper Science, 1997. 23(12): p. J565-J570.
- Tavares, A.J., H. Tran, and T.P. Reid, Effect of char bed temperature and temperature distribution on fume generation in a kraft recovery boiler. Tappi Journal, 1998. 81(9): p. 134-138.
- Tavares, A. and H. Tran, Field studies on fume chemistry and deposition in kraft recovery boilers. Tappi Journal, 1997. 80(12): p. 117-122.
- Rosner, D.E. and J.J. Pyykonen, Bivariate moment simulation of coagulating and sintering nanoparticles in flames. Aiche Journal, 2002. 48(3): p. 476-491.
- Sarofim, A.F. and J.J. Helble, Mechanisms of Ash and Deposit Formation, in The Imapct of Ash Deposition on Coal-Fired Plants, J. Williamson and F. Wigley, Editors. 1994, Taylor & Francis: Washington, D.C. p. 567-582.
- Wagoner, C.L. and X.-X. Yan. Deposit Initiation via Thermophoresis: Part 1 — Insignt on Deceleration and Retention of Inertially-transported particles. in Conference on Inorganic Transformations and Ash Deposition During Combustion. 1991. Palm Coast, Florida: ASME.
- Byers, R.L. and S. Calvert, Particle Deposition from Turbulent Streams by Means of Thermal Force. Industrial and Engineering Chemistry Fundamentals, 1969. 8(4): p. 646-655.
- Castillo, J.L., D. W.Mackowski, and D.E. Rosner, Photophoretic Modification of the Transport of Absorbing Particles Across Combustion Gas Boundary Layers. Progress in Energy and Combustion Science, 1990. 16: p. 253-260.
- Gökoglu, S.A. and D.E. Rosner, Thermophoretically Enhanced Mass Transport Rates to Solid and Transpiration-Cooled Walls Across Turbulent (Law-of-the-Wall) Boundary Layers. Industrial and Engineering Chemistry Fundamentals, 1985. 24: p. 208-214.
- He, C.H. and G. Ahmadi, Particle Deposition With Thermophoresis in Laminar and Turbulent Duct Flows. Aerosol Science and Technology, 1998. 29(#6): p. 525-546.
- Guha, A., A Unified Eulerian Theory of Turbulent Deposition to Smooth and Rough Surfaces. Journal of Aerosol Science, 1997. 28(#8): p. 1517-1537.
- Bai, H. and P. Biswas, Deposition of lognormally distributed aerosols accounting for simultaneous diffusion, thermophoresis and coagulation. Journal of Aerosol Science, 1990. 21(5): p. 629-640.
- Jokiniemi, J.K., J. Pyykonen, P. Mikkanen, and E.I. Kauppinen, Modeling fume formation and deposition in kraft recovery boilers. Tappi Journal, 1996. 79(7): p. 171-181.
- Mikkanen, M.P., E.I. Kauppinen, J.K. Jokiniemi, S.A. Sinquefield, and W.J. Frederick, Bimodal Fume Particle-Size Distributions from Recovery Boiler And. Tappi Journal, 1994. 77: p. 81-84.
- Wag, K.J., V.V. Reis, W.J. Frederick, and T.M. Grace, Mathematical model for the release of inorganic emissions during black. Tappi Journal, 1997. 80: p. 135-145.
- Kawaji, M., X.H. Shen, H. Tran, S. Esaki, and C. Dees, Prediction of Heat-Transfer in the Kraft Recovery Boiler Superheater Region. Tappi Journal, 1995. 78(10): p. 214-221.
- Baxter, L.L., Influence of ash deposit chemistry and structure on physical and transport properties, in Fuel Processing Technology. 1998, Elsevier Sci B.V.,Amsterdam,Netherlands. p. 81-88.
- Sinquefield, S.A., L.L. Baxter, and W.J. Frederick, Experimental study of the mechanisms of fine particle deposition in kraft recovery boilers, in Proceedings of the 1998 International Chemical Recovery Conference. Part 2 (of 3),Jun 1-4 1998. 1998, TAPPI Press,Norcross,GA,USA: Tampa,FL,USA. p. 443-468.
- Baxter, L.L., Ash Deposition During Biomass and Coal Combustion: A Mechanistic Approach. Biomass and Bioenergy, 1993. 4(2): p. 85-102.
- Tran, H.N., How Does a Kraft Recovery Boiler Become Plugged. Tappi Journal, 1986. 69(11): p. 102-106.
- Kauppinen, E., P. Mikkanen, and J. Jokiniemi, Aerosol Capture of Sulfur and Sodium in Recovery Boilers. Paperi Ja Puu-Paper and Timber, 1993. 75(3): p. 122-125.
- Bosch, J.C., Tappi Journal, 1971. 54: p. 1871.
- Baxter, L.L., T. Lind, M. Rumminger, and E. Kauppinen. Particle Size Distributions in Recovery Boilers. in International Chemical Recovery Conference. 2001. Whistler, British Columbia, Canada: TAPPI.
- Lind, T., M. Rumminger, and L.L. Baxter. Characterisitics of Salt Particles in a Recovery Boiler. in Behavior of Inorganic Material In Recovery Boilers. 2000. Bar Harbor, Maine: AIChE.
- Mikkanen, P., E.I. Kauppinen, J. Pyykonen, J.K. Jokiniemi, M. Aurela, E.K. Vakkilainen, and K. Janka, Alkali salt ash formation in four Finnish industrial recovery boilers. Energy & Fuels, 1999. 13(4): p. 778-795.
- Frederick, W.J. and E. Vakkilainen. Sintering and structure development in alkali metal salt deposits formed in a kraft recovery boiler. in Colloquim on Black Liquor Gasification and Combustion. 2003. Park City, UT.
- Baxter, L.L., T. Gale, S. Sinquefield, and G. Sclippa, Influence of Ash Deposit Chemistry and Structure on Physical and Transport Properties, in Developments in Thermochemical Biomass Conversion, A.V. Bridgwater and D.G.B. Boocock, Editors. 1997, Blackie Academic and Professional: London. p. 1247-1262.
- Sinquefield, S., Deposition of Submicron- and Micron-sized Particles from Combustion of Black Liquor, in Chemical Engineering. 1998, Oregon State University: Corvallis, OR.
- Bernath, P., S.A. Sinquefield, L.L. Baxter, G. Sclippa, C.M. Rohlfing, and M. Barfield, In situ analysis of ash deposits from black liquor combustion. Vibrational Spectroscopy, 1998. 16(2): p. 95-103.
- Robinson, A.L., S.G. Buckley, N. Yang, and L.L. Baxter, Experimental measurements of the thermal conductivity of ash deposits: Part 2. Effects of sintering and deposit microstructure, in Energy and Fuels. 2001, American Chemical Society,Washington,DC,USA. p. 75-84.
- Robinson, A.L., S.G. Buckley, and L.L. Baxter, Experimental measurements of the thermal conductivity of ash deposits: Part 1. Measurement technique, in Energy and Fuels. 2001, American Chemical Society,Washington,DC,USA. p. 66-74.
