Jason Schulthess and Dr. Scott Thomson, Mechanical Engineering
Introduction
The intent of this research was to study correlation between the sound that is radiated during human speech and the resulting vibrations that occur in the skin in regions of the head and neck. This report includes results from two parts of this research. First are the measurement results and the comparisons of frequency content obtained from the vibration of the skin at various locations on the head and neck. The second is a presentation of the results examining the frequency content of the measurement device; this study was motivated by preliminary testing results that revealed possible interference due to the natural harmonics of the measurement device.
Frequency Content at Various Locations
The purpose of this aspect of the study was to determine differences that exist when harvesting data from different location on the head and neck.
Methods
A plate made of a piezoelectric material was placed on a subject’s skin. Piezoelectric sensors function by giving a variable voltage output in response to displacement. The plate was harvested from a commercially available throat microphone (TM) manufactured by Fire Fox Technologies. The subject then spoke a standard sentence, “The birch canoe slid on the smooth planks.” This sentence was taken from the standard “Harvard Word List”. This sentence was used as it makes comparison to other similar speech studies possible by using the same standard speech sounds. This process was repeated at several locations in the region of the head and neck, including: a) lateral to the vocal folds (VF); b) the inferior cartilage of the VF; c) jugular notch; d) glabella (in between eyebrows); e) condylar process (superior, posterior portion of the jawbone, inferior to the temporomandibular joint); f) angle of mandible (inferior, posterior portion of the jawbone); and g) mental protuberance (chin).
Results
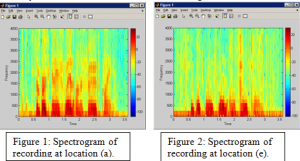
With the data recorded, a frequency spectrogram was created using a program written in MATLAB. The resultant chart displays time (x-axis), frequency (y-axis), and decibels or intensity with a color coded scale. Greater intensity is assigned to the red end of the color spectrum. A sample of the data with the associated locations is given with the following figures. In all cases, there exists high intensity content in the 500 Hertz and below range.

Discussion of Results
At each measurement location, there exists a different frequency content and intensity. This is clearly shown in figures 1 and 2 where figure 2 lacks the content and intensity shown in figure 1 for the 1000-2000 Hertz range. An implication of this data shows that natural filtering of frequency content occurs at location (e) due to underlying physiologic structure of the skin and bone. This occurs due to a difference in the transmission path that the vibrations follow from the VF to each measured location. Using a relative comparison scale, the quality of reproduction of speech from data gathered at each location can be classified as poor, moderate or good. By location:
a) Lateral to VF: moderate
b) Inferior cartilage of VF: poor
c) Jugular notch: poor
d) Glabella: good
e) Condylar process: moderate
f) Angle of mandible: moderate
g) Mental protuberance: moderate
Frequency Content of TM Structure
Methods
[The frequency response of the commercial throat microphone did not appear to be flat, resulting in unnatural-sounding speech. To investigate this, two methods were employed to determine the resonant frequencies of the TM structure. First, an analytic approach using finite element analysis (FEA) was followed. This was accomplished by creating a 3-D CAD model using the software package Pro/Engineer. This model was then analyzed using the finite element software package ADINA. Second, a physical test was performed using the TM structure. The TM was fixed using appropriate boundary conditions and then stimulated using a single pulse input.
Results
Using the FEA approach, it was found that the TM structure naturally resonated at approximately 8000 Hertz. Using the physical method and then computing the natural frequency from the resultant chart the TM structure resonated at approximately 2333 Hertz.
Discussion of Results
The discrepancy between the two values for natural frequency is likely due to one of two reasons: (a) the higher frequency is wrong due to incorrect assumptions about material properties or slight geometric differences between the TM and the model, or (b) the lower natural frequency is wrong due to some unforeseen failure in the physical testing methods. It is assumed that (a) is the primary source of error since additional tests were done that give implication to the range of 3000 Hertz for the correct natural frequency. More accurate results and stronger correlation may be obtained by developing a more repeatable physical test and by including more accurate material definitions in the FEA approach.
Conclusions
The range of frequency of interest for this work was 300-4000 Hz (based on the frequency response of telephones). It is thus very reasonable that the natural frequency of the TM may have influenced the quality of sound recorded. It is also clear from this study that different regions of the head and neck respond differently during speech. This makes some areas more optimal for sensing speech than others. From the data it is clear that locations (b & c) produce the worst quality while locations (a, e, f, and g) produce reasonable but limited quality and finally location (d) which produced the best quality of speech recording and reproduction.
