Clancy Black and Dr. Grant Schultz, Department of Civil and Environmental Engineering
The purpose of this report is to describe work completed for the ORCA sponsored research project “Geographic Information Systems (GIS) and Transportation Safety: A Prototype”. A literature review was conducted to identify the best existing tools and technology. From the research, a GIS model prototype was created to assist in data processing and identification of high-risk crash locations. Applications of the model were tested.
An extensive literature review was conducted from scholarly publications, reports, and 11 different GIS-based crash data analysis programs. From this review several features were identified that are essential for an effective GIS crash analysis program. These include advanced visualization tools, summary statistics, detailed data at micro levels, robust statistical models, and flexibility in analysis methods. A significant void in existing programs is the ability to incorporate roadway data in analysis.
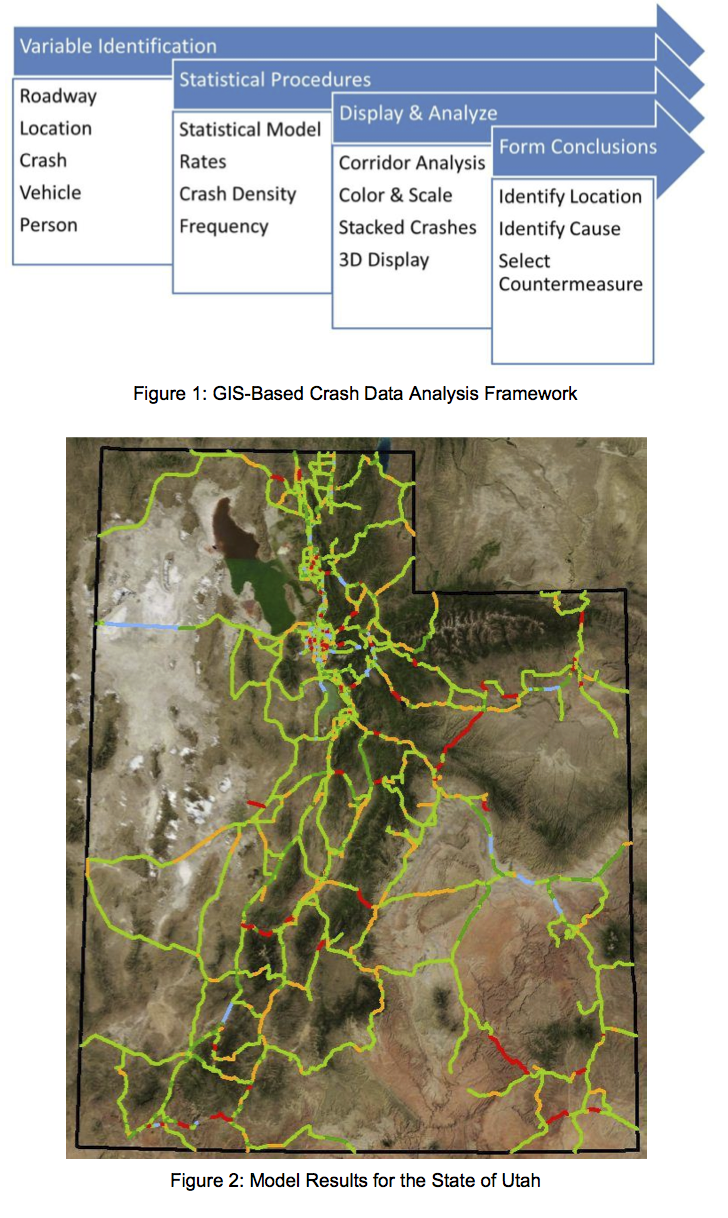
The GIS model consists of a framework for GIS analysis and custom tools developed for crash analysis. The framework for analysis is shown in Figure 1. This framework is meant to be a flexible step-process to help guide the analyst and is flexible enough to work for any crash analysis situation or system. A key feature of the framework is that it is results-oriented. The end goal is not only to understand crash trends, but to understand how safety can be improved. To assist with application of the framework three tools were programmed for use in ESRI’s ArcMAP GIS. These tools automate the process of preparing data for analysis, developing inputs for statistical models, and analyzing outputs of statistical models.
The GIS Model was used to analyze data and produce preliminary results. The model was run for all state owned routes. Data used in the model included functional class, average daily traffic, speed limit, number of lanes, and urban/rural classification. Figure 2 shows the results after processing, input into a statistical model, and preparation of model outputs for visualization. Routes are shown based on crash risk with the highest-risk 5% of routes shown in red and the lowest-risk 5% shown in light blue. These model outputs are valuable for identifying locations that warrant further study.
Two sites were analyzed in-depth to show the value of GIS-based crash data analysis. The first site was milepoint 473.7 on Route 89 through Logan Canyon. This location is of interest to the Utah Department of Transportation (UDOT) because several high profile crashes that occurred there this past winter. This location was not shown as a high-risk site using the statistical model, but further analysis showed that there are some simple and inexpensive countermeasures that could prevent future crashes. The second location was Route 191 between Price and Duchesne, Utah. This has never been identified as a high-risk location previously but did appear as high risk in the model results. In-depth analysis showed that a series of significant vertical and horizontal curves could be contributing to crashes through this corridor.
The GIS Model will be used by UDOT staff in future work to help identify high-risk crash locations. A second research study is currently in progress that will use the results of this project to further develop the prototype and create a standard process for identifying high-crash locations, selecting countermeasures, implementing countermeasures, and then analyzing their effectiveness. The full report of this research will be published by UDOT.

