Ryan Anderson and Dr. Mark Colton, Department of Mechanical Engineering
Introduction
Ongoing research at BYU with the Flapping Flight Research Group (FFRG) is aimed at uncovering the physics behind flapping flight. Discoveries in this field could produce new aircraft designs and technolo- gies, as well as broaden our understanding of natural phenomena. One ambition of the FFRG is to quanti- fy (as determined by lift and thrust) wing trajectories followed during flight. To achieve this quantifica- tion, a precise sensor is necessary to record the lift and thrust produced during each flap.
The FFRG produced an original load cell to measure forces during testing. There arose one significant issue with this original design: it measured bending moments instead of shear force. This sensor errone- ously took into account the location of the force. It became the focus of my research to overcome this ob- stacle and produce a reliable load cell that measured the actual applied forces.
Methods
I began the design process by gathering what information I could from available resources. There are many applications of load cells; however, few published designs measure the level of forces expected during our flight testing (≤ 1 lb). Most typical shear force load cells rely on thin cross-sections to produce measurable deflections. After calculating the thickness required to measure the expected loads, it became clear that it was impractical to pursue such designs.
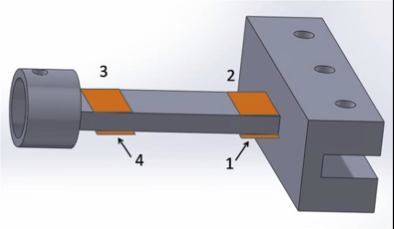
An alternative design offered the ability to discern the desired forces, while remaining within practical tolerances. This design utilizes offset strain gauges placed on both sides of the member (see Figure 1). The load cell was limited in length to not disrupt the fluid flow around the wing and it needed to be thick enough to withstand flapping forces. With this design, the load cell’s sensitivity increased as the thickness decreased and as the gap between the strain gauges lengthened, both of which met limits imposed by the previously mentioned constraints. An effec- tive set of parameters was reached that moderated the overall length and thickness with the necessary sensitivity.
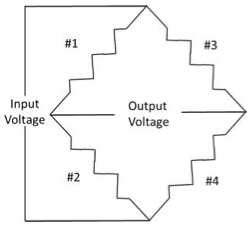
To convert the metal member into a functional load cell, it required the applica- tion of strain gauges. The electrical circuit which connects the strain gauges is governed by the following equation (see Figure 2):
In this equation is the strain experienced by the strain gauges, with the numbering matching up with that which is displayed in Figure 1. For example, if the right end of the member in Figure 1 were to bend down, that would result in positive strain across the two gauges attached to the top of the member. Meanwhile, the two gauges on the bottom would experience negative strain. Using the aforementioned equation, all four strains would combine together to magnify the strain signal. Additionally, the strain of each gauge is related to its distance from the point of force application. Since there are two gauges, one with positive strain and one with negative, set the same distance from the point of force application (#1 with #2 and #3 with #4), they would, in theory, cancel out the dependence on where the force was applied. This is the design selected and developed for the FFRG’s application.
Results
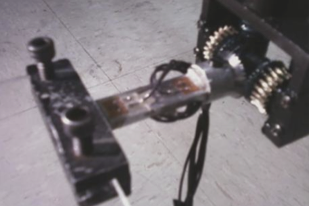
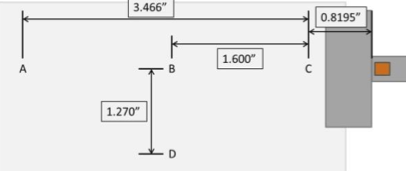
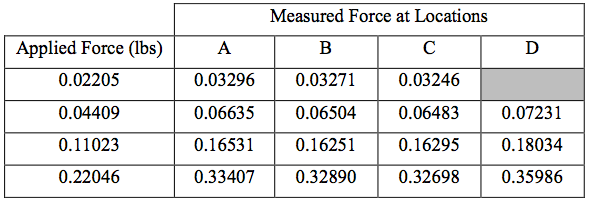
The development of this load cell required careful machining to produce a reliable instrument to the FFRG. Attaching the strain gauges also necessitated extreme care and patience due to their locations’ vital role. The load cell came together as designed and is shown in Figure 3. To determine the actual performance of this load cell, testing was conducted to measure the effect of force location. The results of this testing is shown in Table 1. Four weights were placed individually at each of the locations displayed in Figure 4. The data in Table 1 shows that there is slight variation as the force location is translated away from the gauges, with the measured force increasing as the distance increased.
The data in Table 1 also shows that the measurements need to be re-calibrated. An original calibration was performed 10 months previous, but the strain gauges have been replaced, as has the wiring. The calibration can easily be fixed by adjusting the multiplier used in the data acquisition program.
The last column in Table 1 shows the measurements gathered when the three heavier weights were placed at location D (as shown in Figure 4). These measurements are noticeably higher than the other three measurements of each weight. This result was not accounted for in the original design. The offset from the primary axis produces a torque on the load cell that the gauges can pick up, which skews the measurement. This issue would not present a problem if the forces applied to the wing were balanced from front to back, but it is highly probable that the fluid mechanics will be different on the leading edge as the wing soars in flight. To negate this skew, additional research would be needed to account for the torque about the wing’s main axis.
Two more shortcomings that are part of this design, but are common among all electrical circuits are noise and thermal equilibrium. In this application, the noise level was measured at 0.001 lbs, which is relatively low for what is being measured, but could obscure which wing trajectory is better when the two being compared are very similar. As the conversion factor is changed to improve the calibration, the mag- nitude of the noise will be changed, and so it should be reevaluated as necessary. The other common is- sue is the time needed for the load cell to come to thermal equilibrium. The water it flaps in is one con- tributor to the change in temperature, but even the small voltage that powers the Wheatstone bridge de- scribed above took about 15 minutes to equalize. While it is equalizing, the load cell’s output it useless.
Conclusion
This project has achieved its purpose of improving the FFRG’s ability to measure forces during flight. This project has also furthered the group’s understanding of the actual order of magnitude of the forces experienced. We learned that the load cell is so sensitive that it measured the stiffness of the original wires (taken from a phone cable), which overshadowed the lift and thrust forces. Likewise, the placement of the strain gauges affects the load cell’s overall performance and sensitivity. While a more ideal load cell could be developed, this version settled at a realistic and still useful level. Further research could overcome the remaining obstacles.

