Alene Duersch Cutler and Dr. Debra Mills, BYU College of Nursing
In previous studies, it has been shown that some aspects of growth differ among children who are below considered normal birth weight when compared to children of average birth weight. It is noted that for healthcare providers to apply helpful interventions, more understanding of the actual definition of growth in premature infants needs to be gained. The better providers understand this growth, more appropriate interventions can be identified to help aid these children as they continue to grow and develop. Parents/guardians of severely premature infants can also be advised of possible growth deficits that may occur in the future and of ways to intervene or reduce the effects. Providers can not help parents if they do not know what the growth in these premature infants looks like. Consequently, the purpose of this study was to define and better understand the growth (height, weight, and occipital, frontal circumference) of children born severely prematurely (
Subject data used for this study was previously collected at follow-up appointments held by the Neonatal Follow-up Program of the Utah Department of Health. Participants were invited to take part if birth weight (BW) of ≤1500 grams (g), any infants who required extracorporeal membrane oxygenation support, or infants with hypoxic ischemic encephalopathy. Neonates with a birth weight between 1000 and 1500 g were followed for 2.5 years. Neonates born with a birth weight 
After gaining the appropriate approvals, I began my research by obtaining data files from Maggie Chaney of the Neonatal Follow-up Program of the Utah Department of Health. I entered data into Excel documents provided and previously designed by Chaney. Since this study involved a retrospective analysis of previously collected data, I began the data analysis. Subject data included: 1) weight at birth, 2) age at birth, 3) adjusted gestational age at birth, 4) growth measurements (weight in kilograms, height in centimeters, and occipital frontal circumference (OFC) in centimeters) at assessment taken at each appointment, 5) age (in months) at assessment taken at each appointment. Analysis of data included z-score determination for each appointment measurement through use of a z-score calculator designed by the CDC. Z-scores were obtained to evaluate deviation from the typical growth determined by the CDC for infants’ exact ages.
Data was compared as a whole as well as divided into groups by gender, number of appointments completed, and gestational age (GA) at birth. Data evaluated by GA at birth was further evaluated by comparing weeks individually (22-26 weeks old) and then again clustered in two groups based on level of prematurity: 1) 25-26 weeks old (GA1), and 2) 22-24 weeks old (GA2). After establishing averages for data as a whole, further analysis of the groups previously identified was done for infants who were invited to attend only the first 3 visits and completed each appointment, as well as infants invited to attend all 5 visits and completed each appointment. These two sets of infants were chosen to ensure continuity for more accurate growth rate evaluation. Rates of growth were evaluated individually for weight, height, and OFC by finding the difference of the measurements for the infant’s first and last visit, and dividing that number by the difference of the same infant’s age at the corresponding visits. Hypothesis tests (t-tests), analysis of variance tests (ANOVA), and simple linear regression (SLR) tests were conducted for each of the appropriate sets, groups, and GA subgroups previously identified. Results compared growth rates for correlation to gender, BW, and GA. Statistical analysis of data was performed through use of the StatCruch program provided by the Brigham Young University Statistic’s Department. Other averages and trends were evaluated through use of an Excel worksheet.

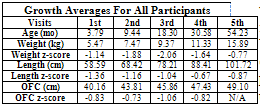
Out of the 290 participants in the study 110 completed the first 3 appointments, 58 completed the first 4 visits, and 23 completed all 5 visits. 132 participants were female, and 158 were males. 257 were identified as being born average gestational age (AGA), while 33 were recognized as being small gestational age (SGA) at birth. GA of infants ranged form 22-26 weeks old at birth with an average GA of 24.9 weeks. Infants’ BW ranged from 391-1185 g with an average BW of 756.8 g. When growth averages for weight and OFC are examined, the corresponding z-score shows that premature infants trend to deviate increasingly more until the 3rd visit. After the 3rd visit, weight and OFC trend closer to the norms. With length however, growth deviation shown by z-scores shows improvement until the 5th visit. This mild decrease in z-score value for the 5th visit could be related to the fact that only the most premature infants were requested to make all 5 visits.
When examining growth rates, infants who completed all 5 visits had slower rates of growth for all three growth measurements than infants who only completed the first 3 visits, with the average growths rates equal for both females and males. Infants who completed the first 3 visits seemed to be more gender dependent with the females growing on average faster in weight and height. Other findings noted greater statistical significance in results related to GA and level of prematurity at birth as seen in the above tables and will be disseminated in later publications.
This research project was an exciting learning opportunity for me as I have just graduated, and been hired on as a Registered Nurse in a Neonatal Intensive Care Unit. I plan on continuing to collaborate with Maggie Chaney and to present and publish our findings later this spring.
