Derek Farnes and Dr. Ryan Jensen, Geography
As the world’s urban population continues to grow, more and more attention is being given to the environment in which humans live – urban areas. Unfortunately, urban expansion often leads to considerable loss of urban forest and its associated amenities. When studying the urban forest, a critical biophysical variable to consider is leaf area index (LAI) which is defined as the ratio of leaf surface area divided by ground area. Due to the importance of this variable, efficient methods have been sought for estimating LAI in urban areas. Potential has been found in measuring LAI with a hyperspectral sensor using many small portions of the electromagnetic spectrum. These narrow hyperspectral bands are sensitive to slight variations in reflectance. Hyperspectral imagery was flown over Terre Haute, Indiana on 24 July 2006 and in situ leaf area measurements were taken in June 2007. Geographic coordinates obtained using a GPS were used to extract reflectance values from the hyperspectral imagery in ERDAS IMAGINE. This resulted in reflectance values for each point from each band.
Unfortunately, the sun angle changed as the imagery was flown and the negative influence of the bidirectional reflectance distribution function can be easily seen in the processed imagery. Given this problem, only two swaths were used in the analysis. As a result, an interesting observation was made when human error temporarily led to the removal of points with LAI values of 0.
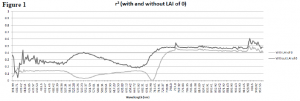
Upon removing the points with LAI of 0, simple linear regression was run on each of the bands. These calculated r2 values can be seen in Figure 1 alongside the r2 values calculated after the mistake was corrected. With the exception of very few bands in the noise around 400 nm, the r2 values are higher when the LAI values of 0 are left out. This illustrates one of the problems of studying the urban forest, that being that urban environments are very heterogeneous and vary greatly. As a result, correlating reflectance with LAI becomes increasingly difficult.
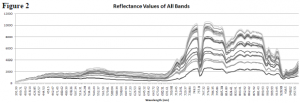
Ultimately, the best r2 values hung just below 0.5 throughout most of the infrared, minus the noise at the edge. Of interesting note is the peak in r2 at 760.18 nm (band 162). This corresponds with an interesting drop in reflectance values for all points as seen in Figure 2, which corresponds with a known atmospheric door where little spectral information is available (Jensen, 2000).
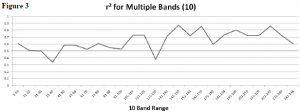
After conducting the linear regression on each individual band, multiple band regression was run on sets of 10 bands. These results were noticeably higher than the single bands, as seen in Figure 3, with r2 values reaching as high as 0.87. In addition to the multiple band regression, linear regression was also run on the normalized difference vegetation index (r2 value of 0.27), the physiological reflectance index (r2 value of 0.32), and a multiple band regression using the highest bands in the blue, red, and NIR (r2 value of 0.50).
Ultimately, the multiple band regression provided the highest r2 values. Additional research still needs to be conducted concerning the drop in reflectance values at 760.18 nm and its associated spike in r2 values. The red edge shift can also be investigated further, particularly the cause behind the drop in r2 values around 705 nm.
With the increase in urban areas and the added stress on urban forests, some progress has been made including several cities throughout the world promoting a “Million Tree” initiative and the Arbor Day Foundation’s Tree City USA program. Efforts such as these have helped to promote the importance of the urban forest and its associated benefits. Ultimately, further research is needed to determine methods to account for the confounding variability of urban environments when studying the urban forest.


