Jisang Sun and Dr. Robert H. Todd, Mechanical Engineering
Introduction
The Continuously Variable Transmission (CVT) is a mechanical device that transfers power from an engine to another device such as a gear box or reducer. It mainly consists of three major parts; a speed sensitive drive pulley, a torque sensitive driven pulley and a V-belt. A CVT has the ability to adjust the gear ratio between the engine and the gear box automatically based on engine RPM and the torque needed to drive the driven pulley. CVT’s are widely used in special purpose vehicles such as all terrain vehicles (ATV’s) and snowmobiles. CVT’s are also used for the national Mini-Baja competition sponsored by the Society of Automotive Engineers (SAE). Several advantages of CVT’s include the fact that they are lighter, simpler, and less expensive than conventional transmissions. They also provide a wide range of gear ratios (3.5:1 – 0.5:1) which adjust their ratio automatically. In addition, they are relatively easy to modify and repair. Surprisingly, little research has been conducted with CVT’s for the Mini-Baja application.
Method
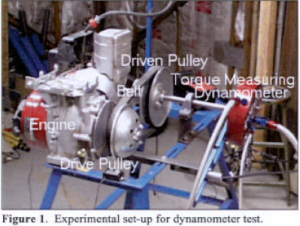
As a member of the winning team of SAE’s Mini-Baja Competition, I wondered how a CVT really works and how a CVT could be optimized for the Mini-Baja application. During the most recent competition, our team used our experience to adjust the CVT rather than any research data. Therefore, this research focused on identifying parameters that would enable a Comet CVT to be optimized for use in future Mini-Baja competitions. During the competition, it is important to be able to accelerate as quickly as possible and take full advantage of available engine torque at various engine speeds. Figure 1 shows the experimental set-up including the CVT, drive and driven pulley, belt, and dynamometer.

There are a number of parameteres that can be adjusted on a CVT. Determining cause and effect relationships between these parameters-the mass of drive pulley cam weights, torsional preload, and compressive preload of the driven pulley preload spring, were chosen for the analysis because they are factors that can be adjusted easily and were believed to have the biggest influences on output torque. A two-level factorial test was designed with three replications. The replications were randomized to increase confidence in the result. The response we measured in the designed experiment was torque output from the driven pulley using a dynamometer.
Result
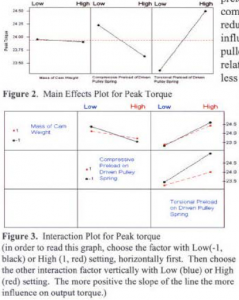
Test results indicate that the biggest influence on torque output thru the CYT was the torsional preload on the driven pulley spring (see figure 2). When more spring torsion preload was applied, output torque was increased. The next most influential variable was the compressive preload on the driven pulley spring. More compressive preload on the spring, however, reduces resulting output torque. The least influential variable was the mass of the drive pulley cam weights, which also had an inverse relationship. The heavier the cam weights the less the output torque. The most influential interaction among the variables was the combination of the compressive and torsional preloads on the driven pulley spring (see figure 3). A combination of high torsional preload and low compressive preload on the driven pulley spring resulted in maximum output torque.

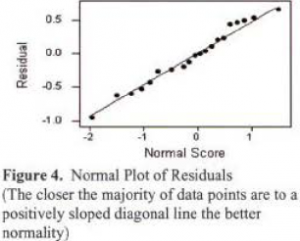
From figure 4, the residual of the model shows normality. This means that the difference between the observed va lues and the estimated values from the model were similar and there were no significant outside effects, validating the model (I).

Conclusion and Future Work
During the experiment, beat was generated from the belt rubbing the sides of the pulleys, as expected. The resulting friction work may bias the experiment data. It may be necessary in the future to study the influence of friction on the performance of the CVT. Tn addition, testing of the Mini-Baja vehicle itself is also important Actual perfonnance of the vehicle with the different settings of the CVT can be measured using a laser speed acquisition device. Further experimentation with the vehicle itself would support the result of this statistical analysis using a dynamometer and is planned to be accomplished within the next several weeks.
Reference
- Montgomery, D.C., G.C. Runger, and N.F. Hubele. 1998. pp. 285, 339-354,381. Engineering Statistics. New York: Wiley.
