Kirk O. Monson and Dr. Bruce G. Schaalje, Statistics
The kappa statistic is defined as the proportion of agreement between two instruments after chance agreement is removed from consideration (Cohen 1960). It is very useful when assessing the similarities of two instruments or procedures. Industries often use an automated system for testing their products to ensure a level of quality before packaging their goods. Since these systems parts must be periodically replaced, it is necessary to determine if the new components have the same level of accuracy or performance as the old ones. The kappa statistic would be very useful in this situation if a more reliable method for determining confidence intervals was available.
I wrote code in the SAS/IML language that simulated random values of the kappa statistic in realistic situations involving true values of kappa close to 1, more than two categories, and non-uniform marginal distributions. The code calculated the kappa statistic and its confidence interval using three new methods, the bootstrap-t, the accelerated bias-corrected percentile method, and a new percentile method. I evaluated the results by comparing them with the results of previous research.
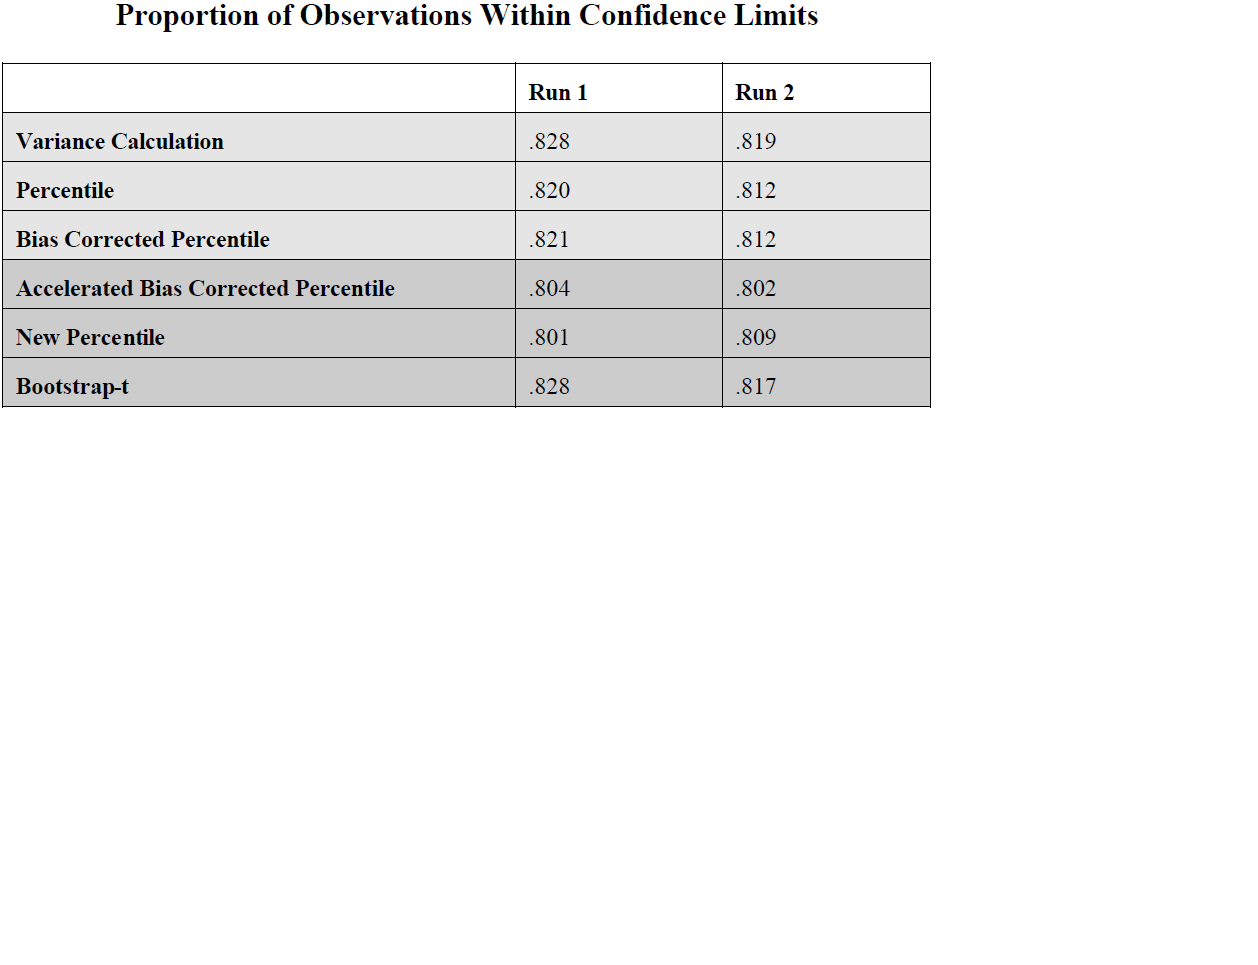
Unfortunately, these three new confidence interval methods were shown to be unsuccessful in improving the reliability of determining confidence intervals for the kappa statistic. In fact, two of the methods, the accelerated bias corrected percentile and the new percentile, performed much worse than the methods previously studied. The bootstrap-t performed about the same. We were expecting these new methods to improve the reliability of determining confidence intervals for the kappa statistic, especially the accelerated bias corrected percentile, so we were surprised with the results.
These are the results of two different runs where I varied the kappa, theta, and number of observations
parameters.