Julie Hollenbaugh and Joseph Price, Economics
Introduction
In this project we explore the long-run economic effects of the dustbowl migration on children in families that moved out of the Oklahoma dustbowl region in the 1930’s relative to children in families that stayed in the region. My primary contribution to this ongoing analysis was the creation of a data set that links individuals across the 1930 and 1940 federal censuses. This allows us to determine which children moved away from the dustbowl region and which stayed, and compare characteristics across the two groups.
Methodology
We began by restricting our sample of individuals to children born between 1922 and 1930 who were living in Oklahoma at the time of the 1930 census. This provided a set of children who would be age 18 or younger in the 1940 census making it more likely for us to be able to observe them living with their parents and siblings in both the 1930 and 1940 censuses. We linked individuals across the two censuses using the basic matching framework identified by Abramitzy et all in their paper “Linking Individuals Across Historical Sources: a Fully Automated Approach,”1, with a few variations. Similar to many linking approaches, we used name, age, gender, race, birth year, and birth place as identifying variables. However, we decreased the probability of both type I and type II matching errors by also using the individual’s parents’ names as identifying variables. Because we restricted the sample to children who are likely to be living with their parents in both census years, we are able to take advantage of these identifying variables to increase matching accuracy. In order to reduce the computational requirements associated with two large data sets, we blocked both the 1930 sample and the 1940 sample by first letter of the individual’s last name. Following this step, we used the Matchit string distance module to generate match-likelihood scores across the blocks, with 1 representing a perfect match between names, and 0 indicating no similarities between the names. We restricted our potential bank of matches to those with a score of .8 or higher.
Of the 439,220 individuals born between 1922 and 1930 who were living in Oklahoma at the time of the 1930 census, about 6% failed to generate any matches above the .8 threshold, which reduced our sample to 413,345 individuals with potential 1940 matches. In determining the probability that two observations are a true match, we required an exact match on gender, then assigned a series of weighted scores for correct matches on ethnicity, birth year, and birth place. Finally, we increased the score if the individual’s recorded parents’ names are similar across the two records. In order to do this, we used the Jaro-Winkler string distance calculator. Similar to the Matchit module, the Jaro-Winkler function generates a score between 0 and 1 for how closely the parents’ names match across the two records. We found that using the parents’ names as identifying variables significantly increased our confidence in identifying which matches are true matches. Using these factors, we assigned each potential set of matches a true match likelihood score between 1 and 4. Via manually checking the accuracy of the matches, we determined that a score of 3.45 and above is almost always a true match. We keep the highest scoring match for each of the 1930 individuals.
Results
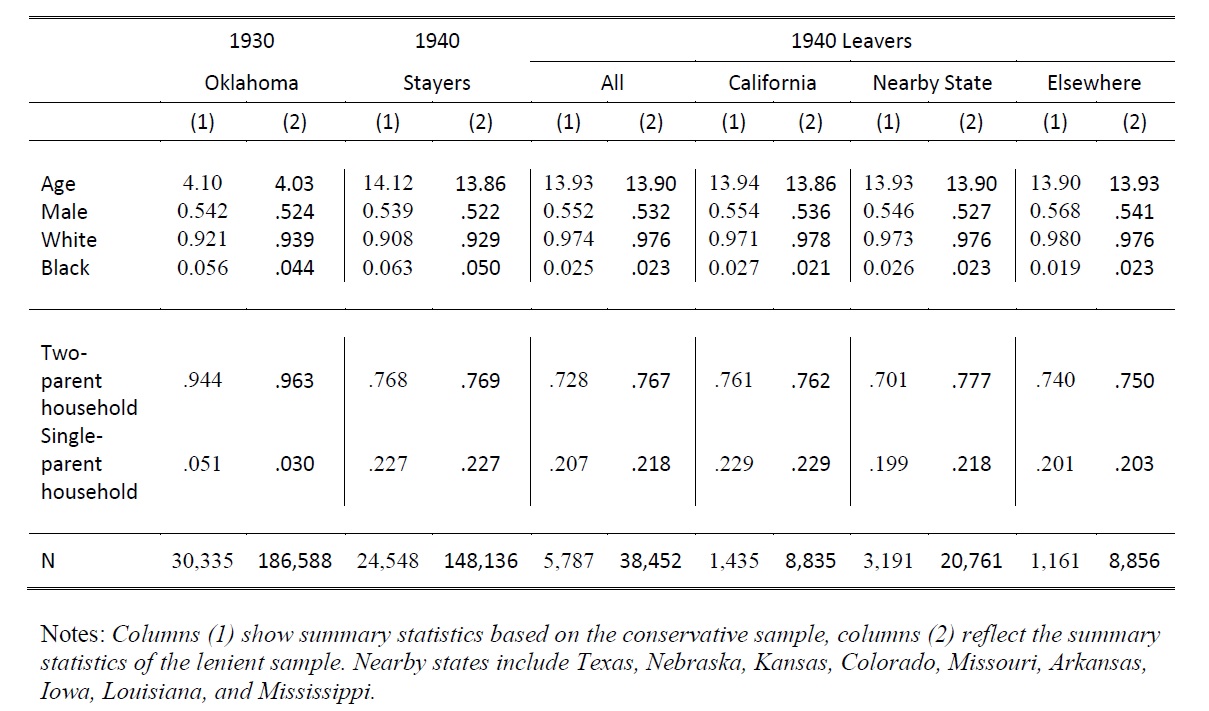
Using this linking method, we produced two sample sets: a conservative set and a lenient set. The conservative set is composed of 30,335 observations, and is limited to only those individuals who were paired with a “perfect match”- the recorded name, ethnicity, gender, birth place, birth year, and parents’ names were identical across the two records. The second set is expanded to include an additional 156,253 individuals with a cumulative score of 3.45 or higher, which allows for some flexibility in transcription or spelling errors that may have occurred in recording names or dates. This second set represents a 45% confident match rate between the original 1930 sample and the 1940 census. Table 1 compares characteristics of children in Oklahoma in 1930 to the children who had moved elsewhere by 1940 as well as to those children who were still in Oklahoma in 1940.
Table 1. Summary statistics of children born in Oklahoma in 1922-1930, conservative and lenient samples.
Discussion
The summary statistics indicate that the groups of leavers and stayers are very comparable in terms of age and gender, but differ slightly in terms of racial composition. Approximately 6% of our conservative sample are black, and 92% are white. The racial makeup of the group that stayed in Oklahoma is very similar, with approximately 6% black and 91% white. However, the racial makeup of the group leaving Oklahoma is approximately 97% white and only 2.5% black. This could indicate that race played a role in a family’s ability to relocate out of the disaster region, and raises the issue of self-selection bias that we address in our paper.
Conclusion
In the remaining part of the project we use the public micro-samples of the 1950 and 1960 censuses to look examine educational and income outcomes for individuals in the relevant time frame. Tentative results indicate that those that emigrated to other states did not end up achieving greater levels of education but did attain 10-15% higher income in the decade following emigration.
1 Abramitzky, Ran, et al. “Linking Individuals Across Historical Sources: a Fully Automated Approach.” 2018.

