
Sierra Pugh and Dr. Matthew Heaton, Department of Statistics
Introduction
Bronchiolitis (an acute lower respiratory tract viral infection in infants) is the most common cause of infant hospitalizations in the United States. The only preventative intervention currently available is monthly injections of immunoprophylaxis. However, this treatment is expensive and needs to be administered simultaneously with seasonal bronchiolitis cycles in order to be effective. To increase our understanding of bronchiolitis timing, this research focuses on identifying seasonal bronchiolitis cycles (start times, peaks, and declinations) throughout the continental United States using data on infant bronchiolitis cases from the US Military Health System. Because this data involved highly personal information, the bronchiolitis dates in the dataset were “jittered” in the sense that the recorded dates were randomized within a time window of the true date. Hence, we develop novel a statistical change point model that estimates spatially varying seasonal bronchiolitis cycles while accounting for the purposefully introduced jittering in the data. Additionally, by including temperature and humidity data as regressors, we identify a relationship between bronchiolitis seasonality and climate.
Methodology
To estimate start, peak, and end times for bronchiolitis seasons, we let ρrt (the probability of a susceptible child contracting bronchiolitis in spatial region r and time window t) follow a spatiotemporal change point model where
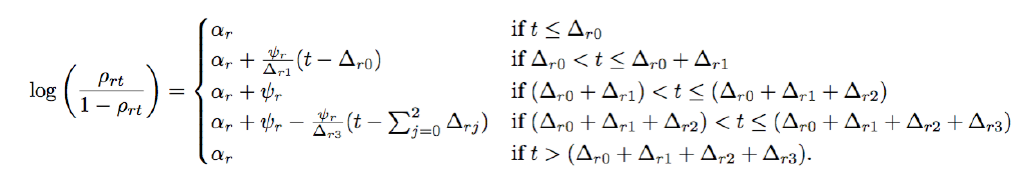
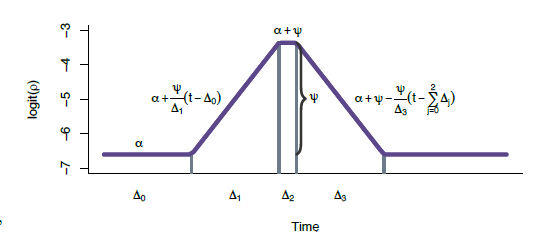
Each parameter in the above change point model can be interpreted in an intuitive manner. Namely, for Δr0 time periods bronchiolitis is “offseason” such that the probability of bronchiolitis in region Rr is low and is given by ρrt = logit−1(αr). For the next Δr1 time periods, logit(ρrt) is increasing linearly until at time Δr0 + Δr1 it hits a peak of αr + ψr such that ψr > 0 denotes the increase in probability from the offseason rate of αr. After staying at the peak for Δr2 time periods, logit(ρrt) then decreases linearly for Δr3 time periods until it returns to the offseason rate at time Δr0 + Δr1 + Δr2 + Δr3. An illustration of this curve is shown on the right. Additionally, to understand why certain areas of the US experience higher bronchiolitis rates than others, we used temperature and humidity data as regressors for ψ (the increase in bronchiolitis rates experienced at peak season).
Each of these parameters was estimated using a Markov chain Monte Carlo (MCMC) algorithm. We chose sufficiently large spatial regions so we knew with certainty which region a child was born in. Thus, we did not need to account for the spatial uncertainty. In order to account for the uncertainty associated with our observed jittered temporal data, at each iteration of the MCMC algorithm we sampled the temporal indices for the birthday, and date a child contracted bronchiolitis (if applicable).
Results
The map shows the posterior mean for the time when that region first reached peak rates (Δ0 + Δ1) which ranges from November 2012 to March 2013. The posterior median and 95% credible intervals for the exponentiated climate coefficients are given in the table. These numbers can be interpreted as the multiplicative increase in ψ given a unit increase in the covariate.

Discussion
In general, the bronchiolitis season seemed to peak earlier in southeastern US with the season peaking around December or January. In comparison, seasons on the West coast tended to peak around February or March 2013. We found temperature significantly affected peak bronchiolitis rates while humidity did not. That is, because the coefficient for temperature was positive, we conclude that warmer winters (relative to the local average temperature) are associated with more extreme peaks in bronchiolitis rates.
Conclusion
Because effective treatment of RSV and bronchiolitis is dependent upon time-sensitive injections, in this research we developed a temporal change point model that was used to (i) estimate the onset and peaks of RSV and (ii) determine the impact of seasonal meteorology on the peaks, while accounting for the jittered data through iterative sampling in a MCMC framework.