Alex Hoagland, Trevor Woolley, and Dr. Lars Lefgren, Economics Department
Introduction
As technology improves, vehicle manufacturers have taken it upon themselves to make and distribute vehicles that are far safer and more reliable than in previous years. In fact, traffic fatalities are on a steep decline in the U.S., with a total of only 32,850 deaths related to motor-vehicle accidents last year as compared to 43,510 recorded in 20051. As the pool of vehicles on the road gradually shifts to newer models, this decline will become more pronounced—according to Consumer Reports, drivers of vehicles made before 2000 are 71% more likely to die in a motorvehicle related accident than drivers of vehicle made after 20102. With significant developments in both vehicle form and function, an accident is both less likely to occur and less likely to be fatal now than it ever has been.
In the last 5 years, 4 states have ended their programs3, and multiple others4 are considering following suit. Currently, there are still 15 states requiring some form of vehicle inspection for motor defects, which we will refer to as vehicle safety inspections. On average, motorists spend between $260 million and $600 million for every 11 million vehicles inspected5. But just how effective is this expenditure, given that vehicles are already safer on average? Would it be prudent for states to put this money into more effective traffic safety programs (such as drinking-and-driving laws, seat belt enforcement, or other vehicle safety measures)?
To answer these questions, we consider the recent impacts of law changes in New Jersey, which recently discontinued the practice of vehicle safety inspections in August 2010. Specifically, we analyze the effects of this policy change on the frequency of accidents due to car failure, as well as total car failure fatality trends both pre- and post-change.
Methodology
We performed this analysis through a synthetic controls approach, one of the newest techniques for policy evaluation in economics. Specifically, this method aims to construct a “what-if” version of New Jersey in which vehicle inspections were not discontinued—when such a control group is created correctly, a direct comparison between it and the actual data reveals the effect of discontinuing the law.
This synthetic New Jersey is constructed by creating a weighted average of states from a control group known as the “donor pool.” In this group are states with similar characteristics to NewJersey—in our case, states that still require regular inspections. A computer algorithm assigns weights to these states based on their similarity to New Jersey fatality data in other aspects— weather, road conditions, the frequency of accidents due to drunk driving or speeding, and so on. By matching on all these pre-intervention trends, we can identify the difference in fatality rates directly attributable to the law change.
Results
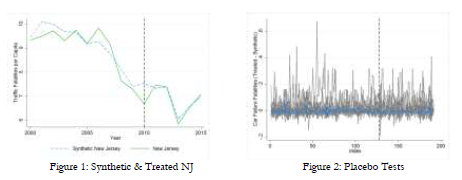
The results were consistent with our hypotheses—the elimination of vehicle safety inspections had no significant effect on the rate of traffic fatalities due to car failure. The results of the synthetic analysis can be seen in Figure 1. This graph illustrates the actual New Jersey data (in green) and the synthetic New Jersey (in blue), with a vertical black line to indicate the year in which the inspection program was eliminated. If there were an effect to the discontinuation of the program, a sharp difference between the two lines would manifest itself in the latter half of the graph—however, there is no such difference.
Discussion
In order to ensure that the result (or lack thereof) was not obtained at random, we performed placebo tests. In these tests, we iterated the above analysis for every state that currently requires vehicle inspections—if the law did have an impact that was simply not visible under this analysis, we would expect the differences between treated and synthetic groups to be smaller in these placebo tests (as no actual law changes were made). Figure 2 shows the results of these tests, with each line representing the difference between a treatment group and its synthetic control. New Jersey’s trend, the actual trend of interest, is shown in blue; notice that it sits comfortably inside the margin of the placebo tests. We are therefore more convinced that this result is not due to chance.
Conclusion
Therefore, we conclude that vehicle safety inspections do not represent an efficient use of government funds, and do not appear to have any significantly mitigating effect on the role of car failure in traffic accidents.
As vehicle manufacturers continue to push for improved safety and reliability in their vehicles, roads will become safer and accidents will be less likely to be caused by car failure. Therefore, states should focus spending in other determinants of traffic fatalities in order to continue the push for safety across the board.
Works Cited
- National Highway Traffic Safety Administration data; see Figure A2 for a graphical description of this decline.
- “How Vehicle Age and Model Year Relate to Driver Injury Severity in Fatal Crashes,” 2013. National Highway Traffic Safety Administration.
- The District of Columbia (2009), New Jersey (2010), Mississippi (2015), and Utah (2017)
- Including Pennsylvania and Texas
- Analysis performed by Cambridge Systematics for Pennsylvania Department of Transportation, 2009.

