Shumway, Adam
Overcoming Under-Reporting: Known Measurement Error
Faculty Mentor: Dr. Joseph Price, Economics Department
Introduction
This project evaluates the feasibility of overcoming measurement error by using predictors for participation. Several national surveys under-represent actual program participation; some actual participants in government welfare programs, for example, fail to truthfully report participation when asked. Using data from these surveys to evaluate these programs’ effectiveness is inherently problematic due to the bias caused by misclassification of these participants.
Methodology
The project included both a theoretical and a practical component. The theoretical component comprised research into bias using Monte Carlo studies where the measurement error’s nature was fully known; the practical component (on which the majority of time was spent) involved predicting participation in the Women, Infants, and Children (WIC) program, using the Nielsen Homescan Consumer Panel (2004-2014). We will first document a summary of the results from the theoretical component, then we will proceed to discuss results from the practical segment.
Results
Intuitively, the project hoped to establish the fact that, even in situations with misclassification error, as long as “sufficiently many” observations are correctly classified, some things can be learned from the data. “Sufficiently many” was not well-defined, but was taken to indicate that at very least, more participants are correctly classified than not, and more non-participants are correctly classified than not. Previous research has shown that in situations where the exact nature and extent of misclassification error is known, unbiased point estimates can be obtained by “scaling up” ordinary least squares estimates.
Monte Carlo simulations showed that significant error remained when using predictor variables to obtain participation estimates in a ranking environment. A nonlinear function was used to generate likelihood of participation based on three covariates, reflecting likely nonlinearity in many real-world contexts. Observations were ranked based on their predicted value in a regression of the y variable on the covariates, and the correct number of observations were marked as ones in order to satisfy a “known” parameter (e.g., actual participation in the WIC program). Regression of y on participation continued to produce biased results, due to the noise in the prediction technique; the covariates did not predict participation very accurately. Any such “ranking method” would have to be highly accurate in order to reduce noise sufficiently to be preferable to ordinary biased results, which are simpler to interpret.
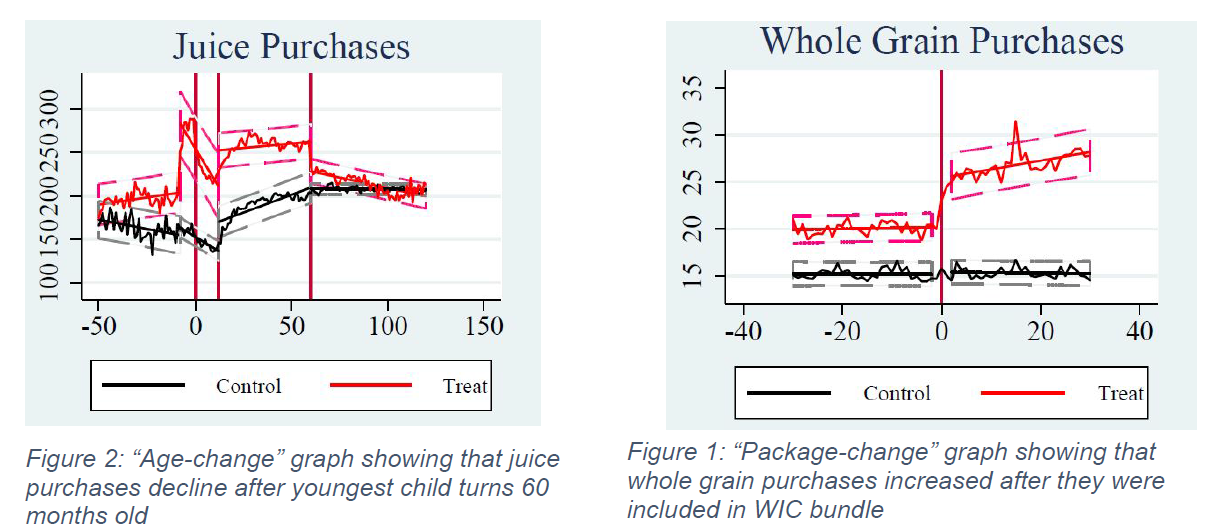
Results on the practical side were more promising, although mixed. The dataset used included both types of classification error. Various multi-step processes were used to predict participation based on food purchases, with the ultimate goal of matching some evidence about the predicted population that was arguably exogenous to the prediction technique: WIC participation rates decrease (and are well-documented) as children age.
We found substantial evidence that our participation approximations were valid. Two types of graphs that were examined with each iteration in the process were “age-change” graphs and “package-change” graphs. After children turn five, they become disqualified from participation. Therefore, there should be some change in purchases around this time. “Age-change” graphs, such as that in Figure 1, reflect this change. Second, the WIC program itself underwent substantial changes in 2009, including the addition of whole-grain breads to the approved food basket. “Package-change” graphs, such as that in Figure 2, show the average amount in certain food categories that was purchased by WIC households.
Most convincing was the matching of the trend in participation with age of the child. In 2010, 55.1% of infants participated in WIC, while only 23.3% of four-year-olds participated. Our numbers were strikingly similar, with a net correlation of 0.978 (Table 1).
Discussion
Results overall were mixed. We did not successfully derive a new estimator for use in the situation we examined, but we did have some practical success in predicting WIC participation.
Conclusion
“Ranking estimators” continue to be biased as long as they are imperfect; however, they become increasingly competent in high-information settings. As with most highly-detailed processes, further improvement could be made to the participation prediction process. For example, the predicted participant population differs more than expected across years (only 1.15% of the sample was predicted to participate in 2013, while about 3.01% was predicted in 2007).
