Michelle Withers and Dr. W. Evan Johnson, Statistics
The human body interacts at a cellular level through a series of events known as biological pathways. These pathways consist of communications at the molecular, cellular, and genetic levels to maintain a healthy, functional body. When the pathways are disrupted, new pathways are formed that can lead to disease. Currently, researchers are trying to understand the role of disrupted and normal pathways in cancer cells. It is necessary to understand the cancerous pathway in order to return the cell to its normal, healthy function.
In this project, I found a way to quantify a pathway and determine if it is present in a cancer cell. This measure is called the Universal Probability of expression Code (UPC). In the end, we were able to identify which cancer samples involved a disrupted RAS pathway.
The UPC method is a step in the right direction for targeted treatment, ultimately improving cancer diagnosis and treatment. The results from this project are currently being incorporated into a paper that will be submitted Nature Methods in July 2010.
Results
The UPC method was slightly altered from the version in the proposal for mathematical reasons and data availability. Because the original data set was not available, we found microarray data from lung cancer patients and an over-amplified RAS pathway. The revised process is as follows:
1. First, the probability of expression was computed for each gene using a novel extension of the MAT model (Johnson et al. 2006).
2. Second, the UPC was calculated for a disrupted RAS pathway and the control cell. Rather than use a standard t-test to select the genes (leading to 0 variance in some genes), the 200 genes with the largest average difference were selected.
3. Third, the UPC values were reduced to binary values and projected into the cancer samples. Projecting consists of calculating the probability of expression for the same genes that are included in the UPC and reducing them to binary values. The number of concordant pairs between a cancer sample and the UPC is a measure of the probability that the pathway is disrupted.
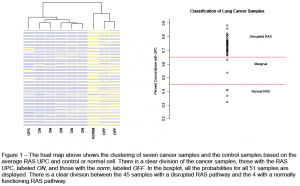
The UPC was projected into 51 cancer samples, 7 of which are shown in the heat map in Figure 1. Clearly, 5 of the samples look more like the UPC than the control, or ‘norm’, while there are two that look more like the ‘norm’ profile. Because of their similarities to the RAS UPC, the genes labeled ON are classified as sample with a disrupted pathway. In the boxplot, we display the percent of expression for all 51 samples and their classification. Overall, 45 genes were classified as having a disrupted RAS pathway, 4 had a normally functioning RAS pathway, and 2 were marginal.
Classifying cancer samples using the UPC of known pathways will help us identify the cause of persons cancer, leading us to the most effective treatment. Using personalized treatment will allow us to optimize treatment for each patient, reducing mortality.

Sources
- Giovanni Parmigiani, Elizabeth S. Garrett, Ramaswamy Anbazhagan, and Edward Gabrielson. “A statistical framework for expression-based molecular classification in cancer”. Journal of the Royal Statistical Society B, 64(4):717–736, 2002.
- Johnson WE, Li W, Meyer CA, Gottardo R, Carroll JS, Brown M, Liu XS. “Model-based analysis of tiling-arrays for ChIP-chip”. Proceedings of the National Academy of Sciences 103:12457-12462, 2006.
