Grant Hodgson and Dr. H. Dennis Tolley, Statistics
In reverse mortgages, homeowners over the age of 62 take a loan out based on the equity of their home. While reverse mortgages can be beneficial for both the mortgager and mortgagee, there is also a great deal of risk involved because it is possible for the value of the loan to become larger than the equity on the home, depending on interest rates and life time of the mortgage. It is important to have a model that accurately predicts the risk associated with the mortgage. Recognizing and appropriately managing risk is becoming increasingly important as the “baby boom” generation reaches retirement age, live longer lives, and take out more and more reverse mortgages. Through a reverse mortgage they will be able to get the cash they need to provide the necessities of life. Because there is an ever increasing number of reverse mortgages in the United States (there has been nearly 500% growth since 20011) creating a more accurate model will help in preventing another source of risk mismanagement.
In order to understand how reverse mortgages are calculated one must understand present values. A Present value can be defined as “The current worth of a future sum of money or stream of cash flows given a specified rate of return.” The idea is that a certain amount of money right now is worth more in the future because that money can be used to gain a return on investment over time.
In the past, models have been made to estimate the present value of a reverse mortgage. One model that has been well used was created by Tom Herzog. In this model he uses life tables from 1990 to obtain mortality rates. He also estimates the move out to be simply 30% of the mortality rate.
In this project we updated the variables used in the calculation of a reverse mortgage with the most recent available data. This allowed for a more accurate model. In our calculations we used mortality rates taken from life tables created in 2008 as well as tables created in 2001 for comparison. The tables used are known as the Valuation Basic Tables (VBT). We also found migration data for the older population (age 65 and older) of the United States from the year 2000 census. This has provided hard data on what the move out rate for older people really is. The interest rate used has also been updated using data available from the Federal Housing Administration (FHA). Part of this project also included writing a function in R (a statistical software package) that would calculate present values for us.
The life tables Herzog originally used were unavailable to us and we were forced to use the 2001 VBT to compare with the more recent 2008 VBT. We also performed calculations to see how the new mobility data would affect the present value of a reverse mortgage. Based on the year 2000 U.S. Census report we found that the move out rate for men age 65-74 was 21.2%.
In one example, we changed the previously mentioned variables and found the present value of a reverse mortgage for a non-smoking male starting at age 65 and ending at age 74. We found the difference between the models to be 0.4539639%. The difference is surprisingly quite small and much smaller than we had anticipated.
There was one major setback that occurred during the process of this research project. We had been working with Tom Herzog and he was going to supply data from the FHA. However, problems arose and we were unable to obtain the data. We were however, able to obtain other data, such as the census data and valuation basic tables as previously mentioned, and therefore were able to continue with the project.
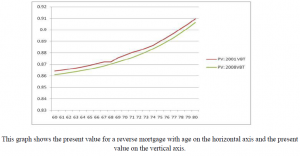
There is still some further research to be done with this project. When we compared the 2001 and 2008 VBT the difference between the two was found to be extremely small. The following graph shows the differences between the two tables when calculating present values:

Thus the 2008 VBT may have less of an impact than generally thought. Its’ financial impact on different products including reverse mortgages requires some further research.
Bibliography
- 2009.https://entp.hud.gov/sfnw/public/ew-defarea.cfm
http://www.calculatedriskblog.com/2009/09/fha-lenders-with-high-default-rates.html - Investopedia. Present Value. http://www.investopedia.com/terms/p/presentvalue.asp. 12/14/2010
- DiVenti, T.R. and T.N. Herzog. 1991. TSA. Vol. 43, 261 -279.
