Jeff Sorensen and Dr. James McDonald, Department of Economics
Main Text
Salary compression is common in many fields with high demand for or low supply of a specific type of labor. In order to attract new recruits in such fields, employers sometimes must offer them wages higher than those of more senior employees. Unlike in most labor markets, there is evidence that returns to seniority for college professors are negative. Ransom (1993), along with many others, found a negative correlation between the number of years at the university and salary after controlling for total workforce experience, research activity, and other variables. He developed a model in which universities act as a monopsony (one buyer, many sellers) and take advantage of professors’ high moving costs, resulting in a “loyalty tax” for professors who stay at their current university. In response to these findings, Moore, Newman, and Turnbull (1998) included additional research-related variables in their models and found that the negative returns to seniority disappear when research activity is more completely controlled for. More recent work, such as that done by Bratsberg, Ragan, and Warren (2003), took into account effects of the faculty/university “match quality” and confirmed the findings that returns to seniority for professors are negative.
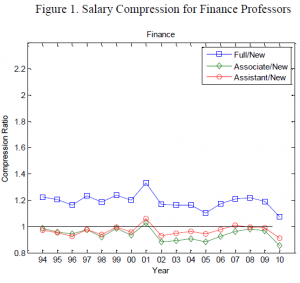
Although much research has been done on the relationship between seniority and salary for professors as a whole, little is known about which professors see the most compression; our work fills that gap. The “Oklahoma State University Faculty Salary Survey by Discipline” is a yearly survey of over 100 public universities that provides the average, high, and low salary for full, associate, assistant, and new assistant professors from hundreds of disciplines. We purchased the last 17 years of data to be able to analyze the differences in salary compression levels between disciplines. We did so by calculating “compression ratios” (the mean salary for a specific level of professor divided by the mean salary for a new assistant professor in the same discipline) for each level of professor in each discipline in each year. We wrote MATLAB programs to analyze the data and produce graphs similar to Figure 1 (which shows that salary compression has occurred for both assistant and associate finance professors) for 15 disciplines. We found that from 1994 to 2010, consistent academic salary compression occurred in the business-related disciplines of accounting, finance, and economics.
While salary compression ratios show the relationship between average salaries for different levels of professors, they do not reveal anything about the underlying salary distributions. An application of order statistics developed by Pocock, McDonald, and Pope (2004) allows a probability density function (pdf) to be fitted to data that includes information only on the minimum, maximum, and mean values and the sample size. We utilized this technique to fit pdfs to the most recent Oklahoma State data (which provides only minimum, maximum, and average salaries and the sample size for each level of professor in a given discipline) for each level of professor for 15 disciplines. We then used Monte Carlo simulations to evaluate the order statistics estimators in comparison to full maximum likelihood estimators. While this order statistics approach to fitting pdfs to data is useful in situations where individual data points are not available, it would be beneficial to know how reliable these estimated parameters are. To investigate this, we generated 10,000 samples of Burr 12 distributed data with a sample size of 615 and parameter values equal to the estimated parameters (from the order statistics method) for economics full professors in 2008-2009 (a=8.020, b=132263.124, q=0.798). We then fit a Burr 12 distribution to each sample using both the order statistics approach, which takes into account only the mean, minimum, and maximum salaries, and full maximum likelihood (MLE), which takes into account each of the 615 generated salaries. The results indicated that full MLE clearly led to better parameter estimates, with RMSE’s around four times as small. Plotting the estimated order statistics and MLE pdfs on top of Burr 12 generated samples with the same sample size and parameters as above, however, shows that the shapes of the two pdfs appear to be quite similar. Thus, applying the order statistics method to individual samples can result in estimates similar to those from full MLE where each data point is known. If using the order statistic method to approximate salary deciles, there would likely be little difference between the two approaches for deciles close to the median, while estimates for extreme deciles would differ more significantly.

References
- Bratsberg, B., Ragan, J. F., & Warren, J. T. (2003). Negative returns to seniority: New evidence
in academic markets. Industrial and Labor Relations Review, 56(2), 306-323. - Moore, W. J., Newman, R. J., & Turnbull, G. K. (1998). Do faculty salaries decline with seniority? Journal of Labor Economics, 16(2), 352–366.
- Pocock, M. L., McDonald, J. B., & Pope, C. L. (2004). Estimating faculty salary distributions: An application of order statistics. Journal of Income Distribution, 11(3-4), 42-50.
- Ransom, M. R. (1993). Seniority and monopsony in the academic labor market. American Economic Review, 83(1), 221–233.
