Craig Daniels and Professor David Fullwood, Mechanical Engineering
Introduction
Electron Back-Scatter Diffraction (EBSD) is a microscopy technique that is used to characterize
crystalline materials such as metals. An EBSD pattern taken at a given point can be used to easily characterize the crystal structure and orientation at that point. By examining EBSD patterns across an area, a grain map is constructed. This gives information about how metals will deform and break. Development of high strength steels is hampered by the lack of an EBSD technique that can reliably identify and characterize martensite. Ferrite and martensite are similar crystal structures (phases) in steel that have very different mechanical properties. The interaction between these phases greatly affects the strength and deformation of steel. Martensite in steel is traditionally identified either by morphology (grain shape and size), or by etching. These techniques are insufficient for investigating high strength steels. Etching reveals only position, not crystal orientation which may be significant in understanding deformation mechanics. On the other hand, morphology of high strength steel is complex enough that reliable phase identification using morphology alone is impractical.
Methodology
Our lab uses cross-correlation to compare similar EBSD patterns. By comparing patterns of
similar orientation, subtle information such as relative strain in the crystal structure can be determined. Lab-developed software generates a simulated EBSD pattern at a known strain state (zero) so that the absolute crystal strain at each point can be calculated. This is based off of the pattern center, which relates the geometry of the sensor to the sample.
We model martensite (tetragonal structure) as ferrite (cubic) with a large imposed ‘strain,’ or distortion from its original state. We analyze EBSD patterns as if they were ferrite, calculate the elastic crystal strain, and then check if that strain has a tetragonal bias. The imposed strain that we measure is of greater magnitude than the elastic limit of ferrite, and thus could not be due to any real strain in the ferrite phase. Not only does this determine the position and orientation of martensite, but it also characterizes the degree to which it is tetragonal. Martensite has varying degrees of tetragonality due to varying carbon content. Thus, measuring the degree of tetragonality can also be used as a measure of local carbon.
Although applying this technique to steel was the main goal of this project, this same technique can also be applied to other materials and crystal phases to find tetragonal variants.
Results
This technique was applied to data collected from various steel types and morphologies.
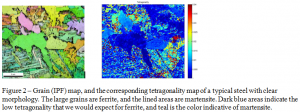
Inconsistencies and irregularities in our results led to an investigation of error in our method. I was also able to present a poster at the EBSD 2014 research conference on my efforts in this project. Another researcher at the conference was presenting on another tetragonal material, thin films of silicon-germanium. We established a collaboration effort with him and analyzed his data. This has been extremely valuable because his material has a known tetragonality that we can compare our results against. In the silicon-germanium we were able to accurately measure tetragonality. (Figure 1) The results of the technique when applied to steel are only partially successful in differentiating between the martensite and ferrite regions. (Figure 2)
Discussion
We discovered that while it is possible to measure a large imposed tetragonal strain, this
measurement is extremely sensitive to pattern center. Errors in this measurement on the order of 50um can introduce, or remove, tetragonalities of 2%, which is on the order of the tetragonality that we would expect for martensite. Because only the pattern center error in a single direction (determined by crystal orientation) effects the tetragonality, this phenomenon affects grains of different orientations by differing amounts. We currently calibrate this pattern center measurement by analyzing a pattern that is assumed to be strain-free.
In the silicon-germanium system, we are able to accurately determine the pattern center based on the areas of pure silicon which are strain-free. Thus the tetragonality can be accurately measured. On the other hand, steels are typically strained during manufacturing processes, and so the strain state of the crystal at any point is uncertain. This makes it very difficult to accurately determine the pattern center. Ferrite can be approximated as strain-free, which is how the pattern center was calibrated in this research, but the purpose of this technique was to independently identify martensite and ferrite structures. A calibration technique that does not assume a strain-free pattern is thus needed.
Conclusion
The technique described above may be able to accurately differentiate between martensite and
ferrite. The largest source of error in this technique is uncertainty in the pattern center. We have pattern center calibration techniques, but currently none of them have sufficient precision to ensure that our tetragonality measurements are accurate. We are continuing to research this problem, and trying various methods to ensure appropriate accuracy. A paper explaining the results found in silicon-germanium samples and the potential application in steel is being prepared for submission to the journal Ultramicroscopy.


