R. Adam Bilodeau and Dr. David Fullwood, Mechanical Engineering
Introduction
Mechanical engineers are constantly seeking better ways to analyze structures and systems, including both flexible, biological materials and rigid, metal structures. However, accurate and inexpensive tools for measuring the changing length of highly flexible systems are difficult to come by. The BYU Nanocomposites research lab is studying a relatively inexpensive material that can provide electrical feedback on the length change of highly flexible systems, allowing for accurate measurements of these systems. This composite material is a mix of Nickel Nanostrands® (NiNs) (small nickel particulates) in highly flexible and extremely electrically inert silicone. The nickel particles cause a slight electrical conductivity in the silicone, however, as the silicone is strained (aka stretched) the conductivity of the composite increases exponentially. It is hypothesized that part of this effect is due to the compaction of the NiNs together. To study this effect, an FEA computer model was developed to evaluate the interaction of two nanostrands with a silicone gap between them. By developing a computer system to automatically run this model with thousands of orientations of the nickel strands, a database of information was developed to facilitate prediction of the conductivity of the silicone composite with hundreds of thousands of particles embedded inside.
Methodology
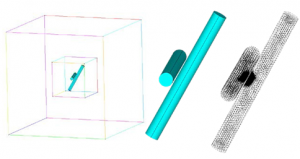
FEA (Finite Element Analysis) techniques are computer analysis methods used by engineers to develop models of materials, apply loads (like strains) and have the computer analyze the resultant changes in the material. The FEA model was developed to simulate the two NiNs as two large rods (with a radius of 50nm) separated by a small gap. These rods were completely encased in a block of silicone material with the properties of Sylgard® 184 (a silicone). This small block was then encased in a larger block of material that was given the properties of the composite material (to simulate immersion of the NiNs inside of a composite material.
The rods (and material) were then meshed to enable the computer to calculate their movements, and record the new location of points along the cylinder. Figure 1 shows the development of the FEA model.

Figure 1 – A representation of the FEA setup. (Left: the two NiNs are encased in two boxes of different materials. Middle: The NiNs in their solid form, with the gap visible between them. Right: The tracking points on the two NiNs after meshing. Note that there is a thick cluster of tracking points at the junction where the two NiNs are closest.
There are three main variables modifying the original gap between the two NiNs that needed testing under strain. By modeling the gap as a vector pointing from the first NiN (consistently chosen) to the second NiN, the gap has both a magnitude and direction relative to the axis of strain. The magnitude was tested at 3 different sizes (3.25nm, 4.5nm and 5.75nm) and the direction was measured using 15° increments of phi and theta on a spherical coordinate system (between 0 and 90°). At each unique gap, the NiNs were rotated (with the gap vector as the axis of rotation, through the center of the NiN), providing 16 unique testing parameters. In all, the possible combinations resulted in 2352 unique test cases, which were solved and evaluated using BYU’s Fulton Supercomputer. Each test was evaluated from 0 to 25% strain, with the location of each NiN being reported every strain step of 1% being reported.
ANSYS Mechanical APDL (version 15.0) was used to perform the FEA analysis with non-linear solutions due to the large deflections.
Results
Due to the complex nature of the meshing involved, most of the solutions crashed after only providing data for 5-7% strain. However, this still provided over 14,000 data points that can be used for prediction of the material properties. MatLAB (R2012b) scripts were used to evaluate the quality of each data set. Any data set that had fewer than 5 data points was sent back to the Supercomputer for reevaluation with smaller strain steps. Once each dataset had sufficient data points to allow for accurate interpolation, another set of MatLAB scripts read the results from the different ANSYS files, calculated the closest distance between the two NiNs at each strain step, and then calculated a linear fit that closely approximated the trend of how the gap was changing.
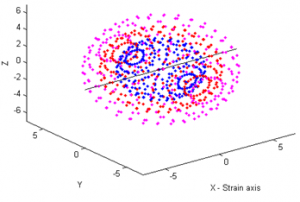
Because the model used a significant amount of symmetry, it is possible to use the data gathered for 1/8th of the sphere to provide solutions for the whole sphere of gap vectors. Figure 2 is a graphical representation of all of the gap vectors for which we now have solutions, where each dot is the tip of the gap vector, projecting out from (0,0,0).
Conclusion
Although some of the orientations were able to provide fewer data points than expected, the data is very robust. We have already been able to gather new insights into the way the NiNs interact with the silicone, and how the gaps between them change over strain. This project has permitted an advancement of the understanding of the properties of these gauges, by building up a new database of possible gaps, and how they change over strain.

Figure 2 – A graphical representation of all the gap vectors for which there is now solution data. Each color represents a different gap size, and the black line running through the center represents the axis of strain that the solution angles are compared against.
