Jeffrey Hoki and Dr. W. Spencer Guthrie, Civil and Environmental Engineering
Before reliable data could be gathered, proper procedures for using a covermeter needed to be established. The American Society for Testing and Materials (ASTM) does not currently have a standard for testing rebar cover depth by means of an electromagnetic covermeter. Therefore, the only protocol for testing available to the tester originates from the manufacturer of each individual covermeter. This research focused on the development of a standardized protocol for covermeter testing to be used within the Long Term Bridge Performance (LTBP) program. The Standardization of covermeter usage will increase the reliability of results gathered from all teams within the program.
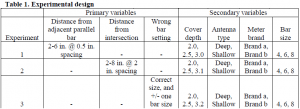
Since cover meters use electromagnetic signals to determine cover depths, non-magnetic material between the meter and the rebar should not theoretically affect the data. To test this theory, cover depth from a concrete slab with a known rebar diameter at a known depth was obtained and subsequent tests were performed on rebar with the same diameter and the same cover but with plywood as the cover material. Since the test showed readings through plywood and concrete have negligible differences, concrete test slabs were not cast for the development of the cover meter protocol. Instead, a plywood box was constructed and used as a template to hold the rebar in the desired configurations for cover readings, greatly reducing the cost of the experiment. The experiment focused on three primary variables and four secondary variables that are known to affect cover readings. The experimental design allowed for a fully crossed experimentation between the primary variable and every non-repeating combination of secondary variables. The layout of the experiment and the tested variables can be seen in Table 1. A dash indicates the variable was not included in the experiment.

One box was constructed to accommodate all three tests. The box was built from 7/16 in. plywood and wood glue. Special care was taken to construct the box without the use of ferrous fasteners to avoid potential distortion of the test results. The box was constructed with four sides, a top, and an open bottom. Five excess sheets of plywood were also cut to match the dimensions of the top of the box. These excess sheets were used to simulate concrete cover by placing one sheet on top of the box for each 0.5 in. increase in desired cover depth. To test the first primary variable, the box was constructed with three horizontal slots 10 in. long and 0.5, 0.75 and 1.0 in. deep to fit rebar sizes #4, #6, and #8, respectively. To test the second primary variable, six sets of holes were drilled in opposite faces of the box allowing each bar to remain at a constant cover depth of 2 in. from the top of the box. These bars were used to simulate the longitudinal bars in a bridge deck. A second set of holes, following the same pattern as the first set, were drilled in the orthogonal faces of the box, such that a transverse bar could be passed underneath the longitudinal bar to simulate an intersection. To test the final primary variable, the longitudinal bar holes from the second test could be used.
Once the box was constructed, the primary variables were tested with each appropriate combination of secondary variables. The Field of View test investigated the effects of the first primary variable, distance to a parallel adjacent bar. The Proximity to an Intersection test investigated the effects of the second primary variable, distance to a reinforcement intersection. The Wrong bar Size test investigated the effects of the last primary variable, wrong bar setting for the meter. Each primary variable was tested with every relevant combination of secondary variables. The results were recorded and will be statistically analyzed to find relevant trends.
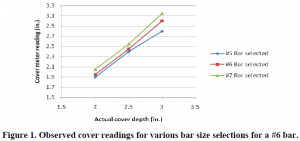
Although the data have not yet been statistically analyzed, some meaningful trends can be observed. For example, Figure 1 shows the influence choosing the incorrect bar size has on cover readings. The chart shows that choosing a lower bar size will yield a more shallow reading while choosing a higher bar size will yield a deeper reading. The data also indicate that the deeper the actual cover, the greater the error will be. However, further investigations would be necessary to prove such a hypothesis.

The original scope for this research was much larger than anticipated, and the project was reevaluated accordingly. This research has been very valuable for my understanding of how testing procedures and protocols are developed. When the statistical analysis is complete, proper protocols for the use of electromagnetic covermeters can be written. These protocols will increase the reliability of the data obtained by the LTBP program and will aid in the prediction of bridge deck life and rehabilitation cost.
