Brittany Spencer and Dr. Shane Reese, Statistics Department
Introduction
Type Ia supernovae play a critical role in understanding the nature of the evolving universe. The Dark Energy Survey is currently investigating the expansion rate of the universe, with the intent to gain insight into the nature of dark energy. One of their primary measures of expansion is Type Ia supernovae (DES Projects, 2011). Due to this type of supernova’s uniformity in formation, most supernova of this type explode to approximately the same absolute brightness (Goobar, 2011).
These supernovae then function as useful galactic measuring sticks because relative distances of supernovae can be inferred from apparent brightness. However, in order to use these supernovae they must first be distinguished from core collapse supernovae. Although two general methods of classification exist, focus is turning to photometry because of the reduction in the time and resources required to collect the data. However, photometric approaches necessitate the modeling of light curves which introduces inefficiency, the inability to consistently classify supernovae, and impurity, the inability to classify only Type Ia supernova as Type Ia (Gjergo et al., 2012). An initial step in overcoming these shortcomings is a flexible modeling strategy for supernova light curves.
Methodology
In this research supernova light curves were modeled with hierarchical Gaussian processes. Gaussian processes are a special case of stochastic processes. A stochastic processes is where the deterministic inputs yield random variable outputs governed by a function. The process is Gaussian if any finite realization of the random variables received as output from the function also follows a Gaussian distribution. A Gaussian process is governed by a mean function and a covariance function where the mean function represents the trend of the process and the covariance function relates a point to those points which surround it.
The data collect for the ith supernova was assumed to follow a Normal distribution, with unknown mean and covariance, where the mean qi is unique to supernova i and can be interpreted as that specific supernova’s light curve. Supernova light curves were assumed to follow a Gaussian process with mean and covariance function specific to supernova type. These hyperparameters were assigned subsequent prior distributions. All prior distributions were selected to exploit conjugacy and as such, draws for parameters could be obtained via successive substitution sampling (i.e. Gibbs) from standard distributions. Code for the analysis was written in both C and R. Several runs of the algorithm, with thousands of iterations each, have been completed; the results presented here were the result of 10000 iterations.
Results and Discussion
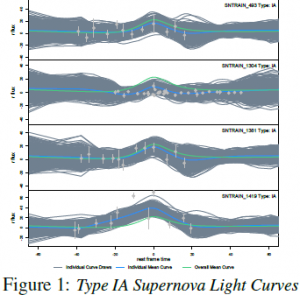
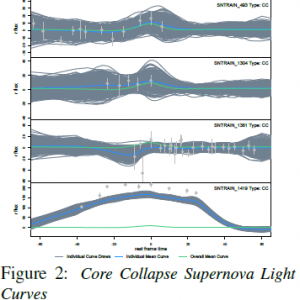
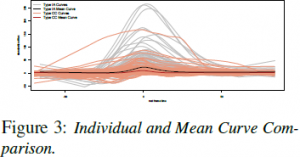
Figure 1 contains the models for a sample of Type Ia light curves. Models for a sample of core collapse light curves are given in Figure 2. Individual curves are in blue, mean curves, specific to type, are in green, and posterior draws for individual curves are in gray. Gaussian process modeling allows for flexible yet simultaneously smooth curves. Additionally, the process successfully recognizes various curve shapes. Posterior draws, a surrogate for posterior predictive distributions, are successful in capturing a majority of the data, indicating overall the fits of the models are good. Curves for data with extreme variation tend to shrink back to the overall mean curve, yet simultaneously capture the general curve shape. This is a feature, rather than a shortcoming of the model, as abnormal curves are much less likely to appear. Additionally, on average, Type Ia curves have more pronounced peaks than core collapse curves. This result is consistent with results in previous photometric analysis and can be seen more apparently in Figure 3.
Mean curves are given on a standardized scale with individual curves as a backdrop. Clear and potentially significant differences are apparent in the type specific mean curves, including the more pronounced peak of Type Ia curves. Although there is variation in individual supernova curves, several locations indicate potential differences that may eventually be useful for classification purposes. However, whether these differences will be enough to classify curves is still being evaluated.
Conclusions and Future Work
These models are still considered a work in progress. Alternative prior distributions and additional levels of hierarchy are still being investigated. Despite the ongoing work, hierarchical Gaussian process formulation allows for flexibility in curve definition coupled with a simultaneous recognition of similarity. In addition, several regions in the flux-phase space yield potential differences in mean light curves that may lead to eventual supernova class differentiation.
Future effort will focus on developing a means of classification through a Dirichlet process for the models fit through the hierarchical Gaussian process outlined above. We are hopeful that this classification mechanism will yield an efficient and accurate means of classifying supernovae.
References
- DES Projects (2011) The Dark Energy Survey. Retrieved from http://www.darkenergysurvey.org
- Gjergo, E., Duggan, J., Cunningham, J., Kuhlmann, S., Biswas, R., Kovacs, E., Bernstein, J., & Spinka, H. (2012). Type Ia supernovae selection and forecast of cosmology contraints for the dark energy survey. Prepared for submission to Journal of Cosmology and Astroparticle Physics. Retrieved from arXiv.org (arXiv:1205.1480v1).
- Goobar, A., & Leibundgut, B. (2011), Supernova cosmology: Legacy and future. Annual Review of Nuclear and Particle Science, 62, 251279.


