Daniel Blake and Dr. Brett Borup, Civil Engineering
Introduction
Determining the degree to which a water source has been contaminated by a pollution source such as a wastewater treatment plant is a difficult problem that has often been considered too difficult or too expensive to solve. Employing fluorescence spectroscopy, a relatively inexpensive measurement, in testing samples obtained from wastewater discharge locations and from locations in the receiving water can help determine the presence of such pollution. Fluorescence spectroscopy generates excitation-emission matrices (EEMs) which can be used as fingerprints of organic pollution in a water source. Additionally, employing statistical methods can improve the ability to fingerprint pollution sources. These statistical methods have been used in air pollution source apportionment studies, and demonstrate the ability to effectively determine the degree to which the water source has been contaminated.
The Heber Valley Special District wastewater treatment lagoons in Heber, UT, treat the wastewater of both Heber City and Midway City, UT. The Provo River is located directly east of the lagoons. The close proximity of the lagoons to the river is suspect, and it is thought that wastewater from the lagoons could seep through the ground and into the river, thus polluting the river. Utilizing fluorescence fingerprinting techniques aids in determining if this seepage and pollution is occurring. Employing Bayesian statistical methods on the data results will further improve the ability to determine the degree to which the water body has been contaminated by the pollution source.
Methodology
Samples from the final wastewater lagoon – called Lagoon 3 – and the Provo River were collected. Samples from multiple sites upstream of the lagoons and downstream of the lagoons were collected. The samples were analyzed using a fluorimeter, which generates the EEMs. Specific data points from the EEMs were extracted and used for the Bayesian hierarchical model. The Bayesian analysis uses a Markov chain Monte Carlo method which determines the fractional contributions of upstream and wastewater sources. The hierarchical model estimates model parameters, and this model generates a distribution of the parameters which provides greater confidence in the results. The results of the analysis are plotted on a graph to display the fractional contribution of each portion – the lagoon and the upstream samples – as well as a 95% credible interval. The Bayesian statistical methods employed in this study demonstrate the ability to effectively determine the degree to which a water source has been contaminated by a pollution source such as a wastewater treatment plant.
Results
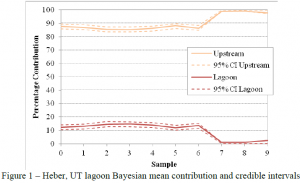
The Bayesian statistical methods employed on the fluorescence spectroscopy data revealed that the wastewater lagoon had a small impact on the Provo River. As displayed in Figure 1, the lagoon had an approximately 10% influence on Provo River, and the upstream had a higher percentage contribution than the lagoon. The upstream had an average percentage contribution of 90%. The contribution varied between samples and between sampling days.
Discussion
The Bayesian statistical methods revealed that the lagoon had a 10% influence on the river, and the upstream river had a 90% influence. That is, the lagoon effluent would account for approximately 10% of the river flow rate. The upstream has a higher percentage contribution, and accounts for most of the river flow, as was expected. Several factors need to be considered. One consideration is that the characteristics of the lagoon at a given time are not the same as the characteristics of the river. The effluent changes daily, and the river water quality also changes daily. However, the lagoon on a given day would not have the same characteristics as the seepage into the river on that same day, as the seepage occurs over a period of time. Another factor is that the last three samples were taken in a different stretch of the river. This is manifested by the last few samples having a lower lagoon effluent contribution than the first samples. This difference in contribution was not expected, and could have been avoided by keeping the sampling point consistent. Additionally, the Bayesian statistical analysis varies based on the data points extracted for usage from the EEMs. That is, the statistical results would change if different data points were selected. The chosen data points were selected based on similar fingerprinting studies, however, and are suitable candidates for inclusion in this research.
Conclusion
The Bayesian statistical methods employed in this study demonstrate the ability to effectively determine the degree to which a water source has been contaminated by a pollution source such as a wastewater treatment plant. These types of analyses have been employed in air pollution source apportionment studies, as well as water pollution studies. This analysis provides great opportunity to determine the presence of a pollution source, and can do so without other physical means or measurements. Bayesian analysis of EEMs is effective in contaminant source apportionment.

