Kelsey Jorgenson and Dr. Eric Hintz, Physics and Astronomy
A large part of astronomical research involves gathering information about celestial objects and drawing conclusions about that information. Astronomers commonly gather data for research projects via sweeping surveys, either of particular regions of the sky or of specific kinds of stars or celestial objects. Data from these surveys are often arranged into catalogues. The aim of my research project was to fill in information gaps in the catalogue of information of known delta Scuti variable stars, particularly in the form of the hydrogen beta, or H-beta, index. I will give introductory information about delta Scuti stars as well as the H-beta index and then proceed to explain my research project and its outcomes.
Variable stars are stars whose apparent magnitude varies over time. This change in brightness has several causes, including changes in the star’s actual intrinsic brightness or variations in the amount of light from the star that is blocked from reaching the earth. Delta Scuti variable stars are a particular kind of variable stars. Their variability is characteristically periodic, with periods ranging from 30 minutes to eight hours.
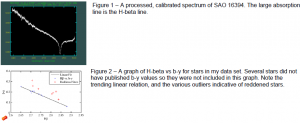
I employ astronomical spectroscopy in my research project. Stellar size, age, temperature, and chemical composition can all be determined using astronomical spectroscopy. The H-beta index is a measure of the depth of the H-beta spectral line with respect to the continuum or response curve. This measure is obtained as follows: calculating the area above the curve of the absorption line with respect to the continuum over a narrow wavelength range centered on the H-beta spectral line (4861 Å); calculating the area above the absorption line over a wider wavelength range centered on the same spectral line; and taking their difference. Higher indices indicate deeper H-beta absorption lines. Refer to Figure 1 for an image of a stellar spectrum. The absorption line is the H-beta line.
The depth of the H-beta spectral line varies in stars. The H-beta index is a reliable indicator of stellar temperature. Additionally, since the H-beta index is calculated using relative depths centered on the same wavelength, the index is reddening free, which means it is not necessary to make corrections to the index based on obscuration of light from interstellar dust. Interstellar reddening refers to the obscuration of light in particular wavelengths due to the presence of dust or matter between the object and the observer. Reddening can be present in measurements when differences in brightness are calculated in two different colors, or brightness measures centered on different wavelengths. One example of a temperature index with reddening is b-y. Because the H-beta index is reddening free and other indices are reddened, plotting the H-beta index against one such as b-y can reveal the extent to which certain stars have portions of their radiation blocked through interstellar reddening.
My involvement in this research project involved extracting the H-beta indexes of the delta Scuti stars that my research advisor Eric Hintz had previously observed. The extraction of H-beta indexes from raw spectral data is a multi-step process. First the data must be processed to reduce noise and correct for imperfections in the digital camera, known as a charge-coupled device (CCD). Then a computer program is used to calculate preliminary or instrumental H-beta index values. Finally, a calibration must be performed to produce indexes that are consistent with the standard definition of the H-beta index. I completed this process for all the delta Scuti stars in the data set taken with one telescope, a 1.2 meter diameter telescope at the Dominion Astrophysical Observatory (DAO) in Victoria, Canada. I am nearly done extracting the H-beta indexes for the stars in the data set taken on the 1.8 meter diameter telescope at DAO. I found that I had to complete this process for each individual night of data, which increased the amount of time it took to complete this task significantly.
Once the H-beta indexes were obtained for most of the data, I compared the delta Scuti stars’ calculated H-beta indexes with their published b-y values. In theory, if the stars’ extracted H-beta indexes are of good quality, they should have a linear relation with their b-y values. Stars whose values do not fall in the linear relation are reddened. Refer to Figure 2 for a plot of H-beta vs b-y of my data set. As the figure verifies, there was a trending linear relation in my data, with the exception of several outliers. The names of these outliers are AD Ari, EE Cam, i Boo, V350 Peg, V365 And, V377 Cep, and V966 Her, and they are most likely reddened stars.
I presented the aforementioned results of my research project as a poster in two conferences, the APS Four Corners research conference held in Ogden, Utah on October 15 and 16, 2010, and the American Astronomical Society conference held in Seattle, Washington on January 9-13, 2011. I also wrote my senior thesis required for graduation in the Physics and Astronomy program on this research project. The Physics and Astronomy Department accepted my thesis and I received an A grade on the paper.
In the future, we hope to complete the H-beta calculation process for all the data my research advisor has, and to prepare the results to be published in an academic journal.

