Artem Davletshin and Dr. Ted Christensen, School of Accountancy
One of the key voluntary disclosures managers can provide to investors is an earnings forecast prior to the end of the accounting period. An earnings forecast (often called earnings guidance) can help investors and financial analysts to more easily forecast future performance and to make more informed investment decisions. This thesis explores why companies choose to start issuing earnings forecasts. This research is not hypothesis driven; rather I take a broader, exploratory approach to finding out why firms begin issuing guidance. In order to investigate this question, I compare a sample of firms known to issue earnings guidance (as indicated in First Call’s CIG database) with a matched sample of similar firms which don’t issue earnings guidance. In order to identify events and firm characteristics that likely affect the decision to issue earnings guidance, I obtained press releases of both earnings guidance and non-guidance firms from the Factiva database. Specifically, I study press releases of IPO firms to determine the types of events that may influence firms’ decision to begin issuing earnings guidance for the very first time. The press releases per se are not important. It is the events reported in the news media that are likely to influence the decision to begin forecasting earnings. I compare the types of events reported in press releases about both earnings guidance and non-guidance firms during the six months prior to the first recorded earnings forecast of earnings guidance firms. In addition to a comparison of the topics of press releases, I also compare firm characteristics using data on company characteristics from the Standard and Poor’s’ Compustat database.
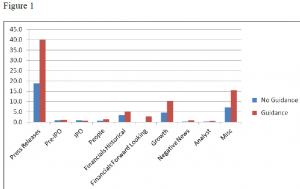
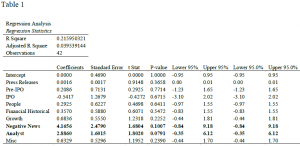
There are several main results. Earning guidance issuing firms experience a greater return on their capital. However, guiding firms also tend to be more leveraged. Guiding firms issue more press releases in general, have more analyst coverage and issue more negative news events. Refer to figure 1 for a graphical representation of the findings and table 1 for a detailed analysis of the results.


