Bryan E. Shepherd and Dr. G. Bruce Schaalje, Statistics
The comet (single cell gel electrophoresis) assay is a highly sensitive method of detecting cellular DNA damage that is often used in cancer research. The “tail moment” is the most widely used measurement of DNA damage in the comet assay. A higher tail moment indicates more DNA damage. In almost all cases the tail moments of a sample of cells do not follow the normal distribution, and often the variation of tail moments between samples of cells exposed to different treatments is unequal. This causes difficulty when performing statistical analyses because these assumptions are necessary in order for t-tests or analyses of variance (ANOVA) to be valid.
We looked at several sets of data and found that in many cases, the tail moments follow a bimodal distribution that can be modeled with a mixture of gamma distributions. This bimodality may be due to cells being in different stages of the cell cycle at the time of treatment.
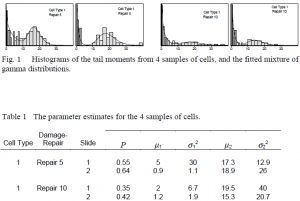
The histograms in Figure 1 are four examples of the distribution of the tail moments in an experiment looking at the effect of thymadine kinase on DNA damage and repair. From visual examination, the samples of cells with Repair 5 are more damaged than the samples of cells with Repair 10. However, is this difference statistically significant? We wanted to be able to come up with a statistical method of differentiating between treatments applied to samples of cells.
We used maximum likelihood, modified to accommodate censored data, to estimate the five parameters of the gamma mixture distribution for each set of cells. The parameters, m1 and s1 2 estimate the mean and variance, respectively, of the first mode while m2 and s2 2 are estimates for the mean and variance of the second mode. The parameter P is the proportion of the data found in the second mode. Figure 2 shows the estimates for the four examples of samples of cells.
The curves over each histogram in Figure 1 are the fitted gamma mixture distribution. It appears that the gamma mixture distribution is a good fit to the data, and we performed statistical tests that confirmed this.
The parameters P, m1, and s1 2 are especially informative. A weighted analysis of variance on these parameter estimates can be performed to determine differences in DNA damage between treatments. This analysis was applied to the thymadine kinase experiment and was found to be more statistically valid, more powerful, and more informative than other methods of analysis.
The results of this research are being reviewed for publication by Mutation Research.

