
Bradley L. Stoker, Department of Economics
In the 1990s, runaway health care expenditures have worried U.S.!awmakers and citizens alike. According to data in the 1995 Economic Report of the President, real per-capita health care consumption (in 1994 dollars) grew an average of 4.7 percent annually between 1948 and 1991, versus a real average NNP growth of only 1.85 percent. The price of health care during the same period increased 6.05 percent annually, whereas the general price index shows an average annual increase of only 4.16 percent. During 1993 and 1994, Congress and the White House sought remedies for health care expenditures that account for about 14 percent of the GNP, or one out of every seven dollars produced.
America is worried. The 1 03rd Congress warned that the Medicare Trust Fund may be bankrupt by the first decade of the twenty-first century. Some physicians tire of working long hours, fearing malpractice, and suffering accusations of creating their own demand.1 Small business owners suffer higher premiums per employee (as a percentage of sales) than large firms do.2 Costs of absenteeism induced by generous health benefits may exceed the costs of medical treatment.
Methodology
0ften used in a medical context, “etiology” refers to seeking the cause or origin of a disease or abnormal condition. For my project sponsored by the BYU Office of Research and Creative Work, I looked at the origins of the seemingly cancerous growth in U.S. Health care expenditures. To model this growth, I gathered data on net national product, expenditures, physicians per capita, relative price inflation of health care, government subsidies for medical facilities construction, and various insurance programs. Next I developed a supply equation and a demand equation with this data. Then I used econometric techniques in running several statistical regressions-one with health care quantity as the dependent variable, and the other with health care price as the dependent variable. The other data served as explanatory variables in the equations used. Since price helps explain quantity and vice-versa, all of the independent explanatory variables from both supply and demand were included in the “reducedform” regressions modeling the equilibrium levels of price and quantity. To yield coefficients that represent elasticities (a measure of responsiveness between two variables), I took the logarithm of the right and left-hand sides of the model’s equations (this elasticity relationship can be proven mathematically). Each variable’s elasticity was assumed to be constant from 1948-91.
Discussion
S !nee price times quantity equals expenditures, the logarithm of price plus the logarithm of quantity equals the logarithm of expenditures. The regression results suggest that net national product, physicians per capita, Medicare outlays per person over 65, medical-facilities subsidies per capita, workers’ compensation medical insurance payments per eligible employee, and group health insurance per employee are positively correlated with health care expenditures; at the 95 percent confidence level, workers’ compensation disability insurance per employee is not significantly correlated with expenditures.
As shown in Table 1, the share of each variable’s Impact on expenditure growth is determined by multiplying each variable’s estimated coefficient by the ratio of the variable’s average annual growth rate over the total expenditures’ average growth rate, which equals 4. 70 percent. For Workers’ Compensation-Medical. for example, .0452 * (.344 I .0470) = .331= 33.1 percent. A total percent explained near 100, as listed in the table, says that the model explains nearly all of the expenditure growth but is slightly overspecified.
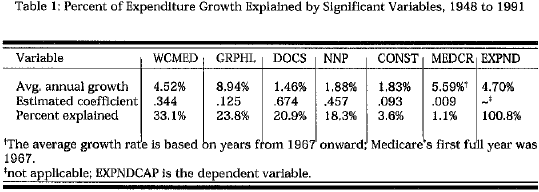
The variables are arranged in decreasing magnitude of their estimated impact on health care expenditure growth from 1948 to 1991. The final column shows both the average growth rate for the dependent variable EXPNDCAP and the total fraction of health care expenditures explained by the previous variables. Workers’ compensation medical insurance explains nearly one-third of the increase in medical expenditures. An examination of the structure of workers’ compensation may explain why.
Unlike group health and other private insurance programs, workers’ compensation is required by law of nearly all employers. Deductibles and copayments are forbidden by law, so the employee’s monetary cost of on-thejob injuries is zero. Once hired, an employee is immediately eligible for coverage of all “reasonable and necessary care.” What is “necessary,” however, can imply anything from the loss of a limb to stress. Although the former example is quite easily diagnosed, only the employees themselves know how severely they are suffering from a more ambiguous condition such as stress. If the doctors confirm the condition’s presence and prescribe treatment, then the employees may be granted time away from work and may be eligible for disability payments. As a result, employees may engage in moral hazard, an economic term referring to people’s participating in more risky (or less careful) behavior when they are insured. Group health insurance and Medicare face the same moral-hazard problems, but Medicare’s Prospective Payment System (instituted in 1983) and the private insurers’ legal ability to charge co-payments make these programs’ impact relatively less substantial than workers’ compensation.
An economic hypothesis somewhat related to moral hazard is the idea of supply-induced demand. Although all profit-maximizing producers (hotdog street vendors, long-distance telephone carriers, physicians, etc.) want demand for their goods to increase, providers of health care are stipulated to have an unusually large amount of influence over demand. Historically, Medicare and many other insurance programs have been financed on a feefor- service basis. As a consequence, doctors are paid according to how many tests, procedures, surgeries, visits, etc. Government has less ability and incentive to regulate workers’ compensation and Medicare because the ability to tax makes the government less worried about keeping costs down. Under such a structure, health care providers can influence demand more strongly than nonmedical agents can influence demand for their products. The .67 4 DOCS coefficient in Table 1 indicates that a 1 0-percent increase in doctors per capita corresponds to a 6. 7 4-percent increase in medical expenditures. Depending on the direction of causality, which the regression does not judge, this coefficient may be suggesting that physician laborsupply response to increases in demand is strong although the lag in the response may be several years. Or it may be saying that the increase of physician concentration per capita after World War II has influenced the growth in consumption of health care. The significant medical-facilities construction variable (CONST) follows a similar line of reasoning.
A positive, significant NNP (income or output) variable suggests that health care is a normal good: as income increases, health care consumption in~ creases by a lower percentage rate, too. International cross-country comparisons yielding coefficients greater than one, as well as the fact that the share of U.S. NNP devoted to health care has increased, may indicate that the income-elasticity coefficient is greater than one. This model, however, includes variables that control for the impact of major insurance programs and therefore yield a lower positive elasticity. A lower elasticity makes sense because a person’s demand for health care as a percentage of income should decrease; the marginal benefit of an additional dollar of health care services falls.
A more complete discussion of this research project can be found in a thesis submitted to the BYU Honors Department, 1995.