Todd J. Strong and Dr. Alan K. Zundel, Civil and Environmental Engineering
Using the Surface Water Modeling System (SMS), models were generated to reflect the situation of bridge abutments being placed in the flow path of a river. Two types of models were generated, a one-dimensional (1D) model and a two-dimensional (2D) mesh. To analyze the models, the 1D program WSPRO and the 2D program FESWMS were used. The 2D models contain more properties of the system, allowing them to be much more characteristic of the actual river, and provide more accurate results. However, 2D models take much more time to generate, edit and analyze. In our tests, the average time to analyze using WSPRO was 30 seconds while FESWMS took 30 minutes. One-dimensional models are able to provide results faster, with less work, and thus less expensively. The concern is whether they can reflect reality well enough to replace the 2D models.
Work began by generation and comparison of a two opening bridge across a river channel. It was soon discovered that WSPRO was unable to accurately model the two opening bridge when the bridge was at an angle across the river. This caused the models to be changed to a one opening bridge. Four different schemes were analyzed: no bridge (control), the bridge at 0o skew, the bridge at 15o skew, and the bridge at 30o skew. These models were each analyzed using both WSPRO and FESWMS and then compared in the areas of:
1. Upstream Water Surface Elevation (Backwater),
2. Cross sectional variation of Water Surface Elevation,
3. and Recirculation Zones.
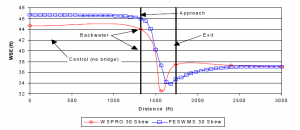
WSE was evaluated upstream from the bridge at a distance equal to the length of the bridge across the river (approach section, see Figure 1). When a structure such as a bridge abutment is added, the upstream WSE rises. A measure of the amount of rise due to the bridge at the approach section is known as the backwater (see Figure 1).
A substantial rise in backwater can lead to flooding, and is therefore carefully monitored. In order for a model to be useful, it must produce accurate backwater values. A backwater value was obtained for each model analyzed and can be seen in Table 1.
From Figure 1 and Table 1 it is easy to see the differences in results from the 1D and 2D models. If we assume the 2D model FESWMS to be accurate, we obtain error up to 49% in the WSPRO results. Also, if the backwater allowance were 2′, then WSPRO would approve both the 0 and 15 skew, while FESWMS would not approve either design
Another area of concern with 1D models is the lack of cross sectional data. WSPRO will calculate a WSE for each point along the river, but will not derive any variation of the WSE at that point. From the plots in Figure 2 it can be easily seen that the WSE does vary along the cross section of the river. In the plot of the approach section, the water is increasing in elevation at the abutments as it pools up, and decreasing in elevation as it drops down under the bridge. The exit section is just the opposite. A representation of this is very important if the river bends or turns, as super-elevations could rise above the river on one side and cause flooding.
The last concern with 1D models is that they do not create recirculation zones. A recirculation zone is an area where the water spins within itself. Concern comes with larger recirculation zones, which could cause harmful scouring of the abutment foundation. In analyzing the results of the FESWMS models it was seen that recirculation zones did exist in the 15 and 30 skew runs.
From the research done it is concluded that the 1D program WSPRO does not give accurate representation for the single-opening bridge situation we modeled. The 1D model is unable to show recirculation zones, cross sectional variation and creates backwater values that are too low and thus unsafe. From these observations it would appear that 1D models are good for generalizations, but are not accurate enough for final evaluation of a river system.


