Garret L. Hart, Department of Geology
Introduction
For decades, geologists have used crystals fragments to characterize volcanic ash deposits. This requires identification and analysis of the mineral crystals and fragments contained in the ash. It is known that ash deposits can have two basic types of crystal fragments-those that are broken by impact in the explosive ejecta from the volcanic vent and those that are separated from larger crystal aggregates in the magma chamber. Crystals that have been broken are typically euhedral, while those have been separated from larger crystal conglomerates tend to be anhedral in shape. Characterization of ash deposits utilizing the differences in the two types of crystals has been inhibited by the lack of a systematic, quantitative method of identification and differentiation. A computer model for the characterization of crystal fragment analysis will be developed in this paper. The primary goal of this project is to numerically differentiate crystal fragments whose forms are a result of impact breakage (euhedral) from those whose forms are a result of their separation from larger crystal aggregates (anhedral). Ultimately, such information can establish the significance that the crystal’s shape has in regards to the volcanic processes that formed the ash deposit.
Methods
Two study sights were used in this project as sources for preliminary end-member examples of the euhedral and anhedral fragment types. The first sample is from the Bauers Tuff (CND, euhedral), and the second sample is from the Nugent Tuff (COPPER, anhedral).
Ten crystal fragments were identified and isolated within each sample. The crystals were then converted to a digital format for computer manipulation and analysis. Outlines for each fragment were created on the computer. Coordinates for 128 equally spaced boundary points for each fragment were obtained. These boundary coordinates were then converted into dimensional coefficients using a Fourier transform which has J (128) harmonics (Erhlich and Weinberg, 1970; Russ, 1990). In this project, 128 harmonics were used. The amplitudes for each harmonic were calculated according to the following equation:
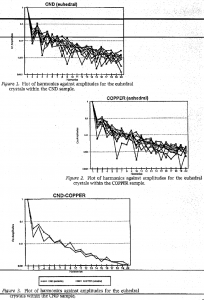
In this equation, C represents the amplitudes, and A and B represent the Fourier coefficients. Plotting the amplitude against the harmonic or frequency gives a comparison between the two samples (Figures 1 and 2). Only the first 20 harmonics were plotted, because the majority of the shape information is contained in them with only superficial information contained in the higher harmonics (Russ, 1990).
Results and Discussion
The crystal fragments used in this project are distinctly different In shape, a fact that is readily seen with the naked eye. Converting the fragments’ shapes to a Fourier series emphasizes the differences and allows a numerical fragment characterization approach to be taken. The Fourier series contains information regarding the shape of the fragment In the varying harmonics of the series. Therefore, the differences in the fragments’ shapes are expressed in a comparison of the amplitudes for
the given harmonics. As it turned out, only the second, fourth, ninth, fifteenth and sixteenth harmonics proved to be different enough to tell the samples apart (Figure 3). The other amplitudes for the varying harmonics are not visible different enough to tell apart from one another. This arises from the fact that the shape information contained in the Fourier series is not significant for that particular harmonic.
Ideally, a comparison of the measured amplitudes could be compared to an idealized shape as an end-member. For example, for the euhedral endmember, a perfect square or rectangle could be used, and for the anhedral end-member, a geometrically symmetric shape containing cuspate indentions (similar to a simple puzzle piece with shallow indentions) could be used.
A comparison of just the critical harmonics for each sample grain would give us the desired characterization. However, the model was developed for two end-member cases, which may lead to some problems for samples located in the middle of the spectrum.
Also, statistical analysis of the amplitudes needs to be conducted to determine if the variation is significant. This would include running a significance test on the specific harmonics to determine whether they are different enough from the end-members. In addition to statistical efforts, a larger sample size would benefit this model. More samples from each end-member group would add confidence to the model and provide a broader base for comparison of fragments. These problems are the focus of upcoming research.
Conclusion
Preliminary tests provide a successful systematic, quantitative model for determining the differences between crystal fragments. The two crystal types are distinguishable by their crystal fragment constituents, and a graphical, numerical method for identification is possible. Application of this model coupled with larger sample sizes and statistical analysis will provide geologists with a powerful tool for the characterization of volcanic tuffs.
References
- Erhlich, R, and Weinberg, B. “An Exact Method for Characterization of Grain Shape.” Journal of Sedimentary Petrology. 1970. 40(1):205-212.
- Russ, J.C. Computer-Assisted Microscopy. New York, Plenum Press, 1990. 453 pages.

