Qing Xia and Dr. Brian Morse, Computer Science Department
The original idea for this project was conceived at the Center for Instructional Design (CID) at Brigham Young University. CID suggested a need to develop software tools for dynamically selecting a good background color for a web page design, given an image to be placed on that page.
Selecting colors to display together can often become a problem in the domain of color science. Most people cannot easily appreciate the values of the theoretical analysis without real-world applications. On the other hand, design experts have been working deliberately to find good solutions for color selection problems in digital applications based on color theory. Despite the great efforts of these professionals, there is still a need to make the process of creating web pages convenient for common users.
This research resulted in a computer program which analyzes user-provided images and suggests background colors. This way, the program narrows almost an infinite number of color choices to a few so that web page designers can easily make decisions on the background color for the web page. Due to the time and resource constraints at the time, an assumption has been made to simplify this research: dominant hues of the image are often optimal choices for its web page background. Since the HSI color space is close to human intuitive perception on colors, the HSI color space has been chosen to carry out value analysis. The research is backed up by color/visual theories and web-page design principles.
The program relies heavily on the Java Image and Graphics Library (JIGL) that has been developed by Dr. Morse’s research lab. This library includes routines for I/O, in-memory signal and image storage, signal element and image pixel access and manipulation, display routines, and so on. The following is the series of steps used to achieve the proposed goals.
Step 1: Read in the image and obtain raw data
The first step of the algorithm acquires the raw image data. As mentioned previously in the background section, computers store and display image information according to the RGB color model. As such, each pixel in an image is described by a triplet of values representing the respective red, green, and blue values of an image. The RGB color model provides convenience for machine implementation, therefore the program reads in color information at each pixel of the image as RGB values. Each of the three values in the triplet is an 8-bit value ranging from 0 to 255.
Step 2: Transform data from RGB to HSI
Since the HSI model is much more intuitive to human perceptions compared with the RGB model, the next phase of the program transforms the raw RGB data to HSI values. Once the image is represented according to the HSI color model, the program has the ability to analyze color information according to hue, saturation, and intensity. This is advantageous because the human eye and brain perceive colors in a similar manner. The formula of the transformation between the two models is given as follows:
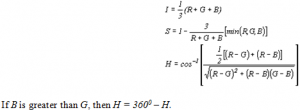
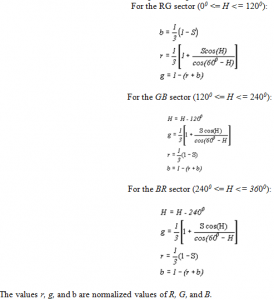
During a later stage following the data transformation, it is necessary to transform the new HSI values back to RGB values so that the resulting images can be easily displayed by computers. The following is used to perform the transformation back to the RGB system:
To convert from HSI to RGB, the process depends on which color sector H lies in
Step 3: Hue histogram
Because serving the need of the CID group is one of the primary objectives of this work, advice and suggestions have been obtained from that group. John Uibel, an artist with the CID, observed that among hue, intensity, and saturation values, it is most important to first capture the optimal choice of hue. In other words, once the hue is fixed, it is relatively easy to choose appropriate intensity and saturation values. Based on this valuable observation, the next step of the program determines the dominant hue of an input image. The dominant hue of an image can be determined from the hue histogram. The program takes all the pixels within a given image as an individual population and categorizes the population or data by a histogram, which is a relative frequency distribution of hues within the domain of the image. Thus, by counting the frequencies of each hue values, from 0 to 359 degrees, at all the pixels, the system builds a hue histogram. The peaks of the histogram represent the dominant hues in this image.
To demonstrate this technique, consider the following example for the image parrots. For added clarity, this phase of the program has been subdivided into five steps.

a) Basic hue histogram
The first step is to build a basic hue histogram directly based on the raw HSI data. This histogram provides a statistical view on the relative frequencies of occurrence of each of the hues that appear in the image. The program counts the occurrence of each hue value within the full range of the HSI color wheel, which goes from 0 to 359 in degrees. The histogram shown in Figure 5 successfully captures the major hues in this image: red, yellow, green, and blue. Basic histograms, however, implicitly assume that each pixel contributes equally to the perception of hue. This assumption, however, is inaccurate because some pixels contribute more heavily to the overall appearance of hues in an image. In particular, low-saturated colors contribute less to the perception of their hue. As such, the basic histogram needs to be refined with saturation information.

b) Saturation weighted hue histogram
Saturation gives a measure of the degree to which a pure color is diluted by white light. As saturation decreases, colors appear more “washed out”. Thus, the objective of saturation weighting is to increase the dominance of the hues that are highly saturated. In such a scheme, the hue of a pixel with a high saturation value will contribute more heavily to the overall hue histogram. For the sake of simplicity, this program simply uses the saturation value of each pixel as the pixel’s saturation weight for its hue in the hue histogram.
In the parrots example, the saturation weighting makes the yellow in the image to stand out much more from the rest of the major hues in the image (see Figure 6). This is because the yellow pixels in the image have relatively higher saturation values. This is consistent with the observation that highly saturated hues should be given more dominance.

c) Spatially weighted hue histogram
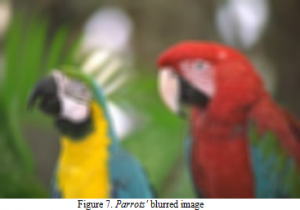
A contiguous region of pixels of the same hue will appear more dominantly to the human eye. Conversely, if many of the neighboring pixels of a given pixel are of different hues, the human eye will lessen the importance of the given pixel. To achieve this objective, a spatially weighted hue histogram is used. In this context, spatial weight is defined as the closeness of a pixel’s hue to its neighborhood average. To obtain the neighborhood average, the program uses uniform blurring of the image. At each given point with coordinate (x, y), the system checks the difference between the original hue and the blurred hue. If the absolute value of the difference is large, the pixel’s hue receives less weight in the hue histogram; otherwise, it receives more weight. When calculating neighborhood averages for each pixel, the program only includes the pixel value when it is not the center itself so that it can focus on the influence on the average from neighboring pixels rather than the center itself. Figure 7 is the blurred the parrots image, where the hue value of each pixel is actually the neighborhood average from the original image.
To grant a fair weight to each pixel, the following steps have been taken to generate weights. The system follows the principle that the closer the hue is to its neighborhood average, the more weight it should be given. A Gaussian distribution as shown in Figure 8 is a natural mechanism for assigning these weights. The variance of this distribution is calculated for each image. As the distribution’s variance gets larger, the curve spreads increasingly outwards such that pixels with large variation do not get penalized as much. Therefore, for a less noisy image, the variance should be smaller, and conversely, the variance should be larger for a noisier image.
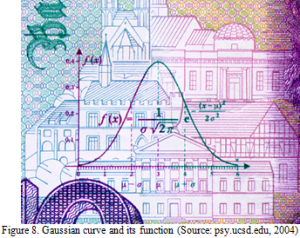
We first calculated the standard deviation, and then use a Gaussian distribution with the deviation to weigh the pixel.
The next figure (Figure 9) shows the spatially weighted histogram. It shows that the spatial weight keeps the histogram values of red, yellow, and green close. One can see that this result makes sense by looking at the image itself—all three of the colors have nice coherence or clusters in each own neighborhood, and yellow has the best coherence.

d) Saturation and spatially weighted hue histogram
Both saturation and spatially weighed hue histograms have their own emphases and they are also biased in unique ways. Therefore, it is useful to combine the two weighting systems together. By multiplying both weighting values with the original hue, the system generates the following double-weighted hue histogram (Figure 10).
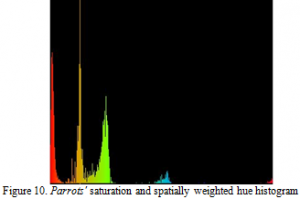
As one can see, this doubly weighted hue histogram shows a result that contains information for both the saturation-weighted histogram and the spatially-weighted histogram.
e) Smoothing histogram
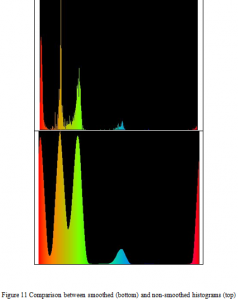
After obtaining the doubly weighted histogram, we smooth the histogram so that it can be used to easily pick out the dominant hues. Figure 11 shows the smoothed result. For comparison purposes, the top image is the original saturation and spatially weighted histogram, and the bottom image is its smoothed version. One can see that in the smoothed histogram, both local maximum and minimum values are easily determined. This will aid subsequent steps in the picking the local extreme values.
Besides providing an easier way to choose local maxima, the smoothed histogram comes closer to the visual image itself. By simply viewing the image, one can not really tell much difference, in terms of dominance, between the three hues: red, yellow, and green. The smoothed histogram matches closely to this human perception, which is the underlying goal of this work.
Step 4: Find local maximum and minimum hue values to get hue bands/ranges
The algorithm used to find the local maximum is simple. Starting from the beginning of the histogram, any hue value that occurs more frequently than both of its neighbors is collected as a local maximum. Then, from each local peak, the program traces down both sides to find what hues’ numbers of occurrences are less than both of their respective neighbors. Those hue values are collected as local minima. With the local minima, the system is able to cut the histogram into bands for all the dominant hues.
Step 5: Find average values of intensities and saturations within each hue band
Within each hue band, the program builds histogram of both intensities and saturations. Figure 12 shows the intensity histograms for each hue band of the parrots image. This figure displays both the original and smoothed intensity histograms.
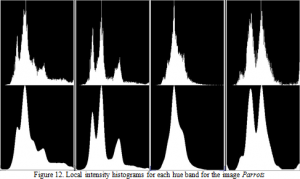
These groups of local intensity histograms correspond to the hue band from red, yellow, green, and blue, respectively. This result indicates that yellow is brightest dominant hue in this image. This result is consistent with what the human eye see. However, for the simplicity, the program takes the local averages of the intensities and saturations as the values of different hue bands.
Step 6: Use the selected HSI values to form suggested colors for the web page

After obtaining the hue, intensity, and saturation values, the system now generates the colors above. The result is promising, although the generated colors do not exactly match the ones in the image. This is because the program analyzes all the pixels in the entire image and takes the average values of intensities and saturations within each hue band. By screening and selecting those local peaks of both intensities and saturations, more work needs to be done on this issue in future work.
Results

For the Ski image in figure 14, the program suggested two dominant colors, red and blue. And the system-generated colors match the image’s original colors closely.
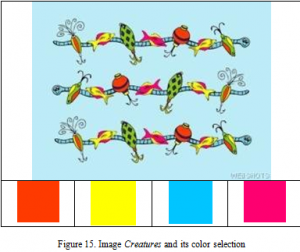
For the Creature images in Figure 15, the pink has been generated by taking average values and this is not obviously represented in the original image. Other than the pinkish color, other colors do come close to the original dominant colors.
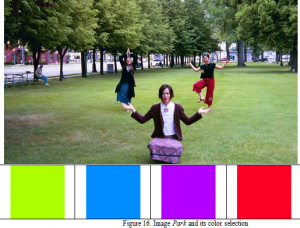
The result of the Park image in Figure 16 is most promising so far. Visually, the blue, red, purple and green are the hues that strongly stand out from the image. However, the clusters of blue, red, and purple are small, it is possible that the program would miss picking out the three hues as dominant ones. But the it did really well in constructing the color blocks for these three hues. One can see that the selected color blocks match really well with the hues and tones of the original image.
Most of the results are basically satisfying our needs or preference. However, because the algorithm gathers data from an entire given image, aggregated bias may result from doing any weighted or non-weighted averaging. The limitation here is the hard time with distinguish the less clustered colors (usually with different saturation values) from the more standing out clusters of hues. And this will some times skew the histogram towards the non-dominant colors in the image.
The digital image processing techniques employed in this research successfully captures most of the dominant color characteristics of a given image.
The implemented program does reasonably well in analyzing and suggesting one or a few dominant colors for the targeted image. It successfully narrows down the user’s options to a few. These suggested color choices are more relevant to the studied image itself. Therefore those options are more relevant for the background color of the web page that uses the given image.
For the sake of simplicity, it is assumed that an optimal color choice can be generated by a dominant hue and the average values of intensity and saturations within this hue band throughout the original image. Notice that this simplified approach has some drawbacks when the image itself has much intensity and saturation variations. In this case, the suggested color options may not appear to be obviously relevant to the colors of the given image. Future study can be done to improve this aspect by picking the multiple dominant intensities and saturations within each dominant hue band.
