Ben Zhang and Dr. Aaron Hawkins, Electrical and Computer Engineering
The ability to scan individual cancer cells that are alive has always fascinated the biomedical research community. Unfortunately, modern day imaging tools, such as atomic force microscopy, electron microscopy and magnetic resonance imaging, have not been successful in achieving that goal. The Scanning Impedance Imaging (SII) project hopes to successfully scan an individual living cancer cell and provide the biomedical community with a new imaging tool.
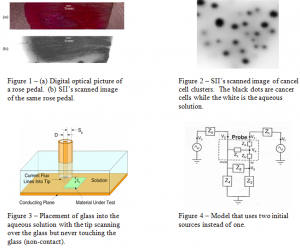
The key to SII’s potential is the “non-contact” method of scanning an object. SII has been successful in scanning larger objects without direct contact; one clear example of a successful scanned image is the rose pedal (Fig. 1). With our black and white image, an observer can see that there are different properties of the rose pedal that one can not observe with an optical imaging method. Thus far, SII has been able to achieve the resolution needed to scan clusters of cancer cells (Fig. 2) but the major obstacle that SII faces is the fact that it cannot obtain consistent images of those cancer cell clusters.
One reason for this inconsistency is that we have never determined the optimal scanning frequency of the initial source and optimal conductivity of the aqueous solution. In order to obtain the optimal frequency and conductivity, we first measured the conductivity values of differing amounts of NaCl (table salt) in 200ml of de-ionized water. Then we immersed a piece of glass in that solution (Fig. 3) and scanned over the glass with varying frequencies of 10, 25, 50, and 100 kHz. The result was then plotted and read to find the measured resolution; the sharpest or best resolution translated to the optimal frequency and conductivity levels.
During the scanning phase, we noticed a glitch in our modeling. We were only plotting the measured voltages and they were being dominated by capacitance at high frequencies, which lead to extremely sharp resolutions. Of course, sharp resolutions meant that we should be getting the optimal frequency and conductivity levels needed to consistently scan the cells, but we still could not obtain consistent images. Thus, to correct the glitch, we resorted to a different type of electrical modeling that used two initial sources instead of just one initial source (Fig. 4). Also, we began plotting the resistor values and capacitance values instead of just the measured voltages.
With our new type of modeling, we expected that the calculated resistor values to be consistent over a range of frequencies. Unfortunately, our resulting data informed us that with differing frequencies, the calculated resistor values were not consistent. Furthermore, our lock-in amplifier burned out midway through the tests and would not give us any additional scanning results. We then tried to find different equipment (ADC/DAC converters, Spectrum Analyzers and Oscilloscopes) to replace the lock-in amplifier but nothing seemed to work as well as the lock-in amplifier. The next equipment that we will test is a C-V plotter.
We have also started to research a new method of scanning, which involves micro fluidic channels for micro organisms to flow through. Currently, we are constructing the channels that are needed for the research and will have working models soon.
Publications are being submitted for the results of our frequency and conductivity scans and for our proposed micro fluidic scanning method. The SII research will take time but when it becomes successful, it will be able to scan single cells and reveal “real-time” mutations of cancer cells, which will give researchers new information regarding cancer cells.

