Todd R. Nelson and Dr. Scott Grimshaw, Statistics
My project for the Research and Creative Activities Scholarship Award looks at the effectiveness and accuracy of a popular new method of variable selection. The method under investigation uses tree-based models to select important variables and then uses classical least squares estimation to fit a regression model with the variables contained in the tree. This research tests the strengths and weaknesses of this approach to modeling as compared with more classical methods.
To introduce each method I will use a data set that has three independent variables (radiation, temperature and wind) and one dependent variable (ozone level).(1) The underlying goal in regression is to find the best regression model using radiation, temperature, and wind to predict ozone level. In variable selection we try to identify a simple model that performs just as good as the full model.
Classical linear regression approaches used to select a best model are stepwise, forward selection, and backward elimination. In each of these approaches variables are included or removed from the model in an iterative process according to a significance criterion. Another approach is comparing all possible subsets of the variable using Mallow’s Cp and R2 as a criterion. In the ozone data the best subset model with one variable is temperature and the best subset model with two variables is temperature and wind. By comparing Mallow’s Cp and R2, we see a big improvement from the one variable model to the two variable model and only a small improvement when we go from the best two variable model to the full three variable model. Based on this approach we would choose our model to be the two variable model that includes temperature and wind. Stepwise variable selection agrees with this conclusion.
Using classification and regression trees (CART) the data is continuously split into homogeneous subsets. Each possible split for each available independent variable is evaluated in a computationally intensive search. The “best” tree contains binary splits chosen according to an optimality criterion. At each end node of the tree a mean is fit to each subset of data. To use CART for variable selection we identify those variables on the splits of the tree and use them in the regression model. In the case of the ozone data temperature, wind, and radiation are all used to split the data and therefore would be selected to use in our final regression model.
Treed regression is very similar to CART in that it also splits the data into homogeneous groups. However rather than fitting a mean to each node of the tree, a simple linear model is used. This essentially reduces the number of splits that will occur. Similar to CART the variables that we select for our regression model are those that appear in the splits and those that appear in the simple regression at each node. The treed regression for the ozone data includes all three variables that again would be used for our regression model.
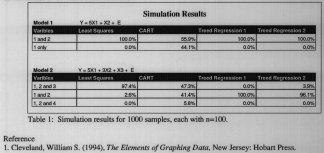
The two concerns tested in this research were tree-based models’ preference toward “steep” variables rather than “significant” variables and how tree-based models are affected by “spurious” variables as opposed to their effect on regression models. The first simulated model created had an underlying relationship of Y=5X,+X2+E. This model was designed to test how the two tree-based methods would respond to a “steep” variable (X,). The second model we simulated had an underlying relationship of Y=5X,+3X2+X3+E. An additional random variable X4 was provided that had no relationship to our dependent variable Y. This model was designed to test the effect of a “spurious” variable (X4) and multiple levels of variable steepness on our three variable selection methods.
The simulation results of a thousand samples are contained in Table 1. Treed Regression I split the data at one level while Treed Regression 2 was allowed to split the data at two levels. The results for model I show the least squares and treed regression picked the correct model every time. However, CART picked the correct model only a little more than half the time. This is due to CART’s bias toward steeper variables. Our results from model 2 show that least squares again does a very good job at choosing the correct model. Treed regression breaks down in this model and favors the two steepest variables. As with model 1, CART choses the right model about half the time in model 2. Another interesting thing to notice about CART is that about 10% of the time it includes our “spurious” variable X4. This suggests that CART has a tendency to attempt to find a model when none is present.
From these simulations we can conclude that both tree based models (CART and treed regression) are highly influenced by steep variables and often neglect other variables. In addition CART includes spurious variables by over modeling. Therefore we recommend that tree-based models should not be used as methods of variable selection for least squares prediction models. Traditional methods have been demonstrated to be much more effective.
1) Cleveland, William S. (1994), The Elements of Graphing Data, New Jersey: Hobart Press.